记一次Oracle 19C RAC ORA-0430
数据库 2025年3月4日21:30-22:30数据库几乎处于不可用状态 ,经 临时查杀会话切换服务后 恢复正常。
问题排查:
数据库告警日志排查:
一节点:由于原业务集中在二节点上,一节点相对较为空闲, ALERT 告警日志 21 点 30 分至 22 点 30 分之间未出现严重的告警和报错信息
二节点:查看 ALERT 告警日志故障时间点出现大量内存分配不足的错误 ,ORA-04030: out of process memory when trying to allocate 248 bytes (KSIPC Top Loca,ksipc pga chnk) ,进程内存( PGA )分配失败,进一步确认此错误在上午 11 点 28分第一次 出现持续了 4 分钟,随后 14 点 26 分陆续出现同时伴随着后台进程中断以及派发失败的错误( Process J000/GCR1/MZ00 died , unable to spawn jobq slave process ), ORA-04030 错误频率过高,同时触发 Oracle 的日志抑制机制( DDE: Problem Key 'ORA 4030' was completely flood controlled )
2025-03-04T21:30:16.594587+08:00
WARNING: inbound connection timed out (ORA-3136)
2025-03-04T21:30:45.978497+08:00
kkjcre1p: unable to spawn jobq slave process
2025-03-04T21:30:45.978550+08:00
Errors in file /u01/app/oracle/diag/rdbms/orcl/orcl2/trace/orcl2_cjq0_56974.trc:
2025-03-04T21:31:08.050594+08:00
Thread 2 advanced to log sequence 83353 (LGWR switch)
Current log# 3 seq# 83353 mem# 0: +DATA/orcl/ONLINELOG/group_3.266.1091824805
2025-03-04T21:31:08.326745+08:00
ARC3 (PID:52999): Archived Log entry 187797 added for T-2.S-83352 ID 0xaf90c6eb LAD:1
2025-03-04T21:31:17.978170+08:00
Process MZ00 died, see its trace file
2025-03-04T21:31:23.076052+08:00
Thread 2 advanced to log sequence 83354 (LGWR switch)
Current log# 8 seq# 83354 mem# 0: +DATA/orcl/ONLINELOG/group_8.322.1091824769
2025-03-04T21:31:23.105092+08:00
ARC0 (PID:52980): Archived Log entry 187798 added for T-2.S-83353 ID 0xaf90c6eb LAD:1
2025-03-04T21:31:49.681514+08:00
kkjcre1p: unable to spawn jobq slave process
2025-03-04T21:31:49.681568+08:00
Errors in file /u01/app/oracle/diag/rdbms/orcl/orcl2/trace/orcl2_cjq0_56974.trc:
2025-03-04T21:32:21.362890+08:00
Errors in file /u01/app/oracle/diag/rdbms/orcl/orcl2/trace/orcl2_j000_19143.trc:
ORA-04030: out of process memory when trying to allocate 25784 bytes (KSIPC Top Loca,KSXP OSD LW CTX)
ORA-04030: out of process memory when trying to allocate 248 bytes (KSIPC Top Loca,ksipc pga chnk)
2025-03-04T21:32:21.506147+08:00
Process J000 died, see its trace file
2025-03-04T21:32:21.506234+08:00
kkjcre1p: unable to spawn jobq slave process
2025-03-04T21:32:21.506279+08:00
Errors in file /u01/app/oracle/diag/rdbms/orcl/orcl2/trace/orcl2_cjq0_56974.trc:
2025-03-04T21:32:53.506189+08:00
Process PPA7 died, see its trace file
2025-03-04T21:33:24.976265+08:00
Errors in file /u01/app/oracle/diag/rdbms/orcl/orcl2/trace/orcl2_j000_68996.trc:
ORA-04030: out of process memory when trying to allocate 25784 bytes (KSIPC Top Loca,KSXP OSD LW CTX)
ORA-04030: out of process memory when trying to allocate 248 bytes (KSIPC Top Loca,ksipc pga chnk)
2025-03-04T21:33:25.102396+08:00
Process J000 died, see its trace file
2025-03-04T21:33:25.102484+08:00
kkjcre1p: unable to spawn jobq slave process
2025-03-04T21:33:25.102528+08:00
Errors in file /u01/app/oracle/diag/rdbms/orcl/orcl2/trace/orcl2_cjq0_56974.trc:
2025-03-04T21:33:57.103192+08:00
Process PPA7 died, see its trace file
2025-03-04T21:34:29.145357+08:00
kkjcre1p: unable to spawn jobq slave process
2025-03-04T21:34:29.145411+08:00
Errors in file /u01/app/oracle/diag/rdbms/orcl/orcl2/trace/orcl2_cjq0_56974.trc:
2025-03-04T21:35:01.145196+08:00
Process PPA7 died, see its trace file
2025-03-04T21:35:32.963592+08:00
kkjcre1p: unable to spawn jobq slave process
2025-03-04T21:35:32.963658+08:00
Errors in file /u01/app/oracle/diag/rdbms/orcl/orcl2/trace/orcl2_cjq0_56974.trc:
2025-03-04T21:36:05.114190+08:00
Process PPA7 died, see its trace file
2025-03-04T21:36:36.599489+08:00
Errors in file /u01/app/oracle/diag/rdbms/orcl/orcl2/trace/orcl2_j000_55290.trc:
ORA-04030: out of process memory when trying to allocate 25784 bytes (KSIPC Top Loca,KSXP OSD LW CTX)
ORA-04030: out of process memory when trying to allocate 248 bytes (KSIPC Top Loca,ksipc pga chnk)
2025-03-04T21:36:36.660996+08:00
Process J000 died, see its trace file
2025-03-04T21:36:36.661095+08:00
kkjcre1p: unable to spawn jobq slave process
进一步查看 trace 文件选取 /u01/app/oracle/diag/rdbms/orcl/ orcl2/trace/ orcl2_ora_36774.trc 为例:
MGA (Managed Global Area) allocation is failed due to ORA-4030 though OS has enough free memories.
Trace file /u01/app/oracle/diag/rdbms/orcl/orcl2/trace/orcl2_ora_36774.trc
Oracle Database 19c Enterprise Edition Release 19.0.0.0.0 - Production
Version 19.3.0.0.0
Build label: RDBMS_19.3.0.0.0DBRU_LINUX.X64_190417
ORACLE_HOME: /u01/app/oracle/product/19.0.0/dbhome_1
System name: Linux
Node name: dbn02
Release: 3.10.0-957.el7.x86_64
Version: #1 SMP Thu Oct 4 20:48:51 UTC 2018
Machine: x86_64
Instance name: orcl2
Redo thread mounted by this instance: 2
Oracle process number: 3421
Unix process pid: 36774, image: oracle@db02
*** 2025-03-04T11:28:15.590583+08:00
*** CLIENT ID:() 2025-03-04T11:28:15.590606+08:00
*** SERVICE NAME:() 2025-03-04T11:28:15.590610+08:00
*** MODULE NAME:() 2025-03-04T11:28:15.590613+08:00
*** ACTION NAME:() 2025-03-04T11:28:15.590617+08:00
*** CLIENT DRIVER:() 2025-03-04T11:28:15.590620+08:00
KSIPC MGA segment precreate succeeded: pga_aggr_limit 51539607552 IPC limit:40% curr allocation:5905580032 new allocation 6174015488 segsize 268435456 hdl 0x7fff37fe9a18
MGA heap extent alloc failed : req = 8388552, min = 8388552
Actual req size = 8388552, min size = 8388552, sctx = 0x3b42cd240, segsz = 268435456
----- Start Diag Diagnostic Dump -----
Diagnostic call stack dump is performed due to inability to allocate memory to generate a new incident during error handling.
DDE is switched to protected mode during the diagnostic dump to prevent recursive errors in the error handling code.
Dump error and call stack for the diagnostic dump:
*** 2025-03-04T11:28:15.644177+08:00
dbkedDefDump(): Starting incident default dumps (flags=0x0, level=1, mask=0x0)
----- Error Stack Dump -----
<error barrier> at 0x7fff37fe9760 placed dbge.c@994
ORA-04030: out of process memory when trying to allocate 248 bytes (KSIPC Top Loca,ksipc pga chnk)
<error barrier> at 0x7fff37fea810 placed ksipc.c@13489
----- SQL Statement (None) -----
Current SQL information unavailable - no session.
匹配 Oracle 官方 MOS 文档 ORA-04030: out of process memory when trying to allocate n bytes (KSIPC Top Loca,ksipc pga chnk) (Doc ID 2853178.1)

出现以上问题主要原因有以下三点:
1.
当前
PGA_AGGREGATE_LIMIT
设置不足
2. 大量 PGA 内存的使用
3. 大量 MGA 内存的使用
解决办法:
增加 PGA_AGGREGATE_LIMIT 的限定值。
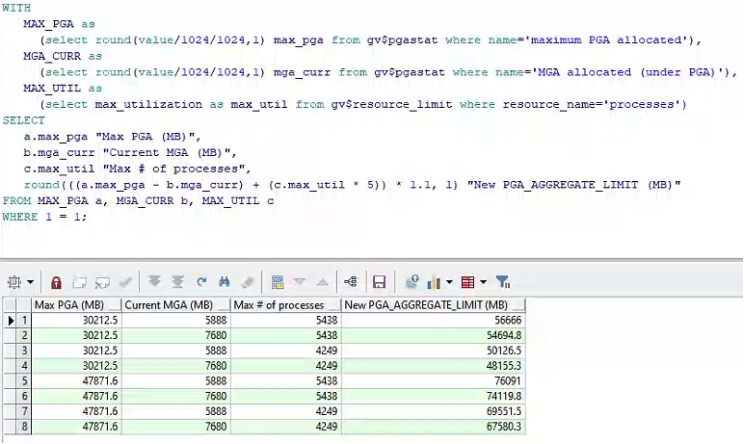
评估 PGA_AGGREGATE_LIMIT 的值
PGA_AGGREGATE_LIMIT = ((maximum aggregate PGA in use for the life of the instance) + ((maximum number of attached processes for the life the instance) * 5M)) * 1.1
来自 “ ITPUB博客 ” ,链接:https://blog.itpub.net/31547506/viewspace-3074865/ ,如需转载,请注明出处,否则将追究法律责任。

最新文章
- Oracle 2026年5月安全补丁:CSPU月度更新机制与紧急应对指南
- Oracle 26ai安全实战:构建基于AI的SQL防火墙与智能体防御体系
- Oracle 26ai智能运维:基于DeepSeek的AWR报告自动诊断
- Oracle 26ai自治湖仓一体:打通Iceberg数据湖与AI分析
- Oracle 26ai实战:零代码构建企业级RAG知识库
- Oracle 26Ai自然语言搜索实战:基于生成式AI的数据库查询
- Oracle 26Ai智能索引推荐实战:AI驱动的自动化性能调优
- Oracle 23c安全性增强实战:细粒度访问控制与数据屏蔽
- Oracle 23c分区增强实战:自动分区管理简化运维
- Oracle 23c区块链表实战:构建不可篡改的数据审计系统
