一、介绍
prometheus
Prometheus 是由前 Google 工程师从 2012 年开始在 Soundcloud 以开源软件的形式进行研发的系统监控和告警工具包,自此以后,许多公司和组织都采用了 Prometheus 作为监控告警工具。Prometheus 的开发者和用户社区非常活跃,它现在是一个独立的开源项目,可以独立于任何公司进行维护。为了证明这一点,Prometheus 于 2016 年 5 月加入 CNCF 基金会,成为继 Kubernetes 之后的第二个 CNCF 托管项目
grafana
Grafana 是一个监控仪表系统,它是由 Grafana Labs 公司开源的的一个系统监测工具,它可以大大帮助我们简化监控的复杂度,我们只需要提供需要监控的数据,它就可以帮助生成各种可视化仪表,同时它还有报警功能,可以在系统出现问题时发出通知。
二、环境搭建
这里采用docker-compose搭建测试环境,具体配置如下
docker-compose-prometheus.yml
# 镜像版本请自行选择 https://hub.docker.com/search?q=&type=imageversion: "3"# 网桥 -> 方便相互通讯networks:prometheus:ipam:driver: defaultconfig:subnet: "172.22.0.0/24"services:# 开源的系统监控和报警系统prometheus:image: registry.cn-hangzhou.aliyuncs.com/zhengqing/prometheus:v2.34.0 # 原镜像`prom/prometheus:v2.34.0`container_name: prometheusrestart: unless-stoppedvolumes:./prometheus/prometheus.yml:/etc/prometheus/prometheus.ymlcommand: "--config.file=/etc/prometheus/prometheus.yml --storage.tsdb.path=/prometheus"ports:"9090:9090"depends_on:node-exporternetworks:prometheus:ipv4_address: 172.22.0.11# 采集服务器层面的运行指标:image: registry.cn-hangzhou.aliyuncs.com/zhengqing/node-exporter:v1.3.1 # 原镜像`prom/node-exporter:v1.3.1`container_name: prometheus-node-exporterrestart: unless-stoppedports:"9100:9100"networks:prometheus:ipv4_address: 172.22.0.22# 用于UI展示# https://grafana.com/docs/grafana/latest/installation/dockergrafana:image: registry.cn-hangzhou.aliyuncs.com/zhengqing/grafana:8.0.0 # 原镜像`grafana/grafana:8.0.0`container_name: prometheus-grafanarestart: unless-stoppedports:"3000:3000"volumes:"./prometheus/grafana/grafana.ini:/etc/grafana/grafana.ini" # 邮箱配置# - "./prometheus/grafana/grafana-storage:/var/lib/grafana"# - "./prometheus/grafana/public:/usr/share/grafana/public" # 这里面可处理汉化包 可参考 https://github.com/WangHL0927/grafana-chinese# - "./prometheus/grafana/conf:/usr/share/grafana/conf"# - "./prometheus/grafana/log:/var/log/grafana"# - "/etc/localtime:/etc/localtime"environment:GF_EXPLORE_ENABLED: "true"GF_SECURITY_ADMIN_PASSWORD: "admin"GF_INSTALL_PLUGINS: "grafana-clock-panel,grafana-simple-json-datasource,alexanderzobnin-zabbix-app"# 持久化到mysql数据库GF_DATABASE_URL: "mysql://root:root@172.22.0.34:3306/grafana" # TODO 修改depends_on:prometheusmysqlnetworks:prometheus:ipv4_address: 172.22.0.33# mysql数据库 => 用于grafana持久化数据mysql:image: registry.cn-hangzhou.aliyuncs.com/zhengqing/mysql:5.7container_name: prometheus-mysqlrestart: unless-stoppedvolumes:"./prometheus/mysql5.7/my.cnf:/etc/mysql/my.cnf""./prometheus/mysql5.7/data:/var/lib/mysql""./prometheus/mysql5.7/log/mysql/error.log:/var/log/mysql/error.log"environment:TZ: Asia/ShanghaiLANG: en_US.UTF-8MYSQL_ROOT_PASSWORD: root # 设置root用户密码MYSQL_DATABASE: grafana # 初始化数据库grafanaports:"3306:3306"networks:prometheus:ipv4_address: 172.22.0.34
启动测试环境
docker-compose-prometheus.yml 需修改grafana中配置的mysql连接信息 prometheus.yml 自行配置
# 运行-f docker-compose-prometheus.yml -p prometheus up -d# 查看grafana日志docker logs -fn10 prometheus-grafana
grafana访问地址:
http://ip地址:3000默认登录账号密码:admin/adminprometheus访问地址:
http://ip地址:9090exporter访问地址:
http://ip地址:9100/metrics

三、代码工程
下面老做一个小实验,实现自定义监控指标
pom.xml
<project xmlns="http://maven.apache.org/POM/4.0.0"xmlns:xsi="http://www.w3.org/2001/XMLSchema-instance"xsi:schemaLocation="http://maven.apache.org/POM/4.0.0 http://maven.apache.org/xsd/maven-4.0.0.xsd"><parent><artifactId>springboot-demo</artifactId><groupId>com.et</groupId><version>1.0-SNAPSHOT</version></parent><modelVersion>4.0.0</modelVersion><artifactId>prometheus</artifactId><properties><maven.compiler.source>8</maven.compiler.source><maven.compiler.target>8</maven.compiler.target></properties><dependencies><dependency><groupId>org.springframework.boot</groupId><artifactId>spring-boot-starter-web</artifactId></dependency><dependency><groupId>org.springframework.boot</groupId><artifactId>spring-boot-autoconfigure</artifactId></dependency><dependency><groupId>org.springframework.boot</groupId><artifactId>spring-boot-starter-actuator</artifactId></dependency><dependency><groupId>io.micrometer</groupId><artifactId>micrometer-core</artifactId></dependency><dependency><groupId>io.micrometer</groupId><artifactId>micrometer-registry-prometheus</artifactId></dependency></dependencies></project>
application.properties
server.port=8088spring.application.name=springboot2-prometheusmanagement.endpoints.web.exposure.include=*management.metrics.tags.application=${spring.application.name}
PrometheusCustomMonitor.java
package com.et.prometheus.monitor;import io.micrometer.core.instrument.Counter;import io.micrometer.core.instrument.DistributionSummary;import io.micrometer.core.instrument.MeterRegistry;import org.springframework.beans.factory.annotation.Autowired;import org.springframework.stereotype.Component;import javax.annotation.PostConstruct;import java.util.concurrent.atomic.AtomicInteger;public class PrometheusCustomMonitor {private Counter requestErrorCount;private Counter orderCount;private DistributionSummary amountSum;private AtomicInteger failCaseNum;private final MeterRegistry registry;public PrometheusCustomMonitor(MeterRegistry registry) {this.registry = registry;}private void init() {requestErrorCount = registry.counter("requests_error_total", "status", "error");orderCount = registry.counter("order_request_count", "order", "test-svc");amountSum = registry.summary("order_amount_sum", "orderAmount", "test-svc");failCaseNum = registry.gauge("fail_case_num", new AtomicInteger(0));}public Counter getRequestErrorCount() {return requestErrorCount;}public Counter getOrderCount() {return orderCount;}public DistributionSummary getAmountSum() {return amountSum;}public AtomicInteger getFailCaseNum() {return failCaseNum;}}
GlobalExceptionHandler.java
package com.et.prometheus.exception;import com.et.prometheus.monitor.PrometheusCustomMonitor;import org.springframework.web.bind.annotation.ControllerAdvice;import org.springframework.web.bind.annotation.ExceptionHandler;import org.springframework.web.bind.annotation.ResponseBody;import javax.annotation.Resource;@ControllerAdvicepublic class GlobalExceptionHandler {@Resourceprivate PrometheusCustomMonitor monitor;@ResponseBody@ExceptionHandler(value = Exception.class)public String handle(Exception e) {monitor.getRequestErrorCount().increment();return "error, message: " + e.getMessage();}}
TestController.java
package com.et.prometheus.controller;import com.et.prometheus.monitor.PrometheusCustomMonitor;import org.springframework.web.bind.annotation.RequestMapping;import org.springframework.web.bind.annotation.RequestParam;import org.springframework.web.bind.annotation.RestController;import javax.annotation.Resource;import java.util.Random;public class TestController {private PrometheusCustomMonitor monitor;public String order( String flag) throws Exception {// 统计下单次数monitor.getOrderCount().increment();if ("1".equals(flag)) {throw new Exception("出错啦");}Random random = new Random();int amount = random.nextInt(100);// 统计金额monitor.getAmountSum().record(amount);monitor.getFailCaseNum().set(amount);return "下单成功, 金额: " + amount;}}
启动类:
package com.et.prometheus;import org.springframework.boot.SpringApplication;import org.springframework.boot.autoconfigure.SpringBootApplication;public class DemoApplication {public static void main(String[] args) {SpringApplication.run(DemoApplication.class, args);}}
code repository
https://github.com/Harries/springboot-demo
四、测试
启动springboot服务,,访问http://localhost:8089/order和http://localhost:8089/order?flag=1模拟下单成功和失败的情况,然后我们访问http://localhost:8088/actuator/prometheus,可以看到我们自定义指标已经被 /prometheus 端点暴露出来
# TYPE order_request_count_total counterorder_request_count_total{application="springboot2-prometheus",order="test-svc",} 34.0# HELP jvm_threads_daemon_threads The current number of live daemon threads# TYPE jvm_threads_daemon_threads gaugejvm_threads_daemon_threads{application="springboot2-prometheus",} 18.0# HELP jvm_classes_loaded_classes The number of classes that are currently loaded in the Java virtual machine# TYPE jvm_classes_loaded_classes gaugejvm_classes_loaded_classes{application="springboot2-prometheus",} 7250.0# HELP order_amount_sum_max# TYPE order_amount_sum_max gaugeorder_amount_sum_max{application="springboot2-prometheus",orderAmount="test-svc",} 97.0# HELP order_amount_sum# TYPE order_amount_sum summaryorder_amount_sum_count{application="springboot2-prometheus",orderAmount="test-svc",} 34.0order_amount_sum_sum{application="springboot2-prometheus",orderAmount="test-svc",} 1482.0
在grafana上配置自定义的监控参数
访问 http://localhost:3000/login ,初始账号/密码为:admin/admin
1、配置数据源
点击左侧齿轮Configuration中Add Data Source,会看到如下界面: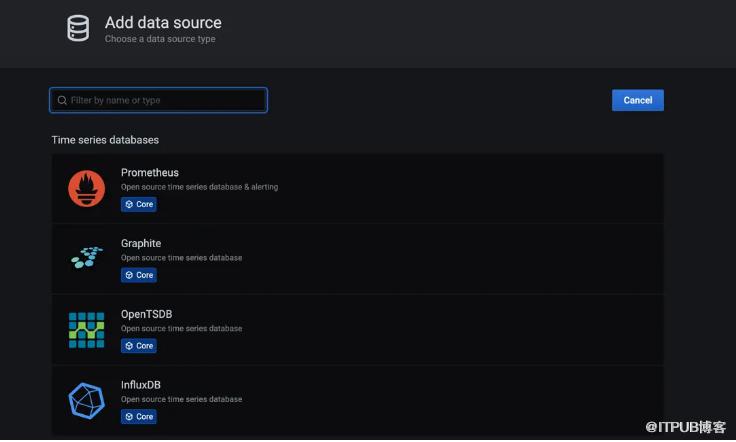 这里我们选择Prometheus 当做数据源,这里我们就配置一下Prometheus 的访问地址,点击
 Save & Test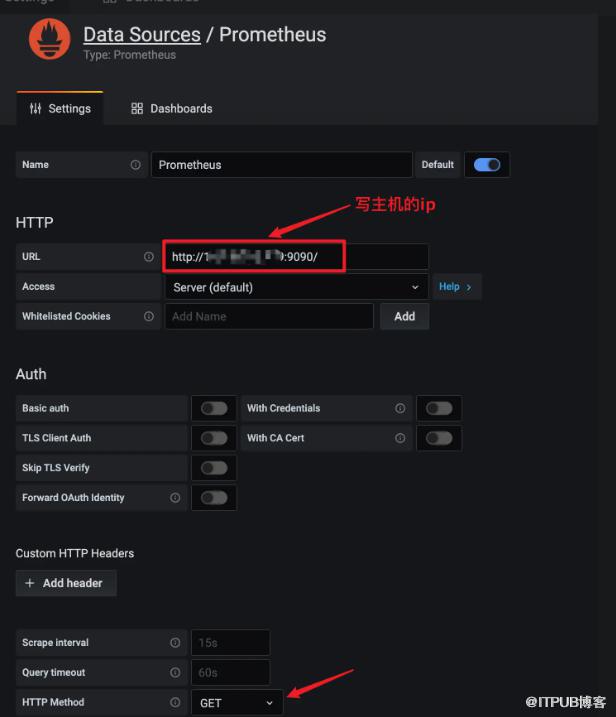
2、创建监控 Dashboard
点击导航栏上的 + 按钮,并点击Dashboard,将会看到类似如下的界面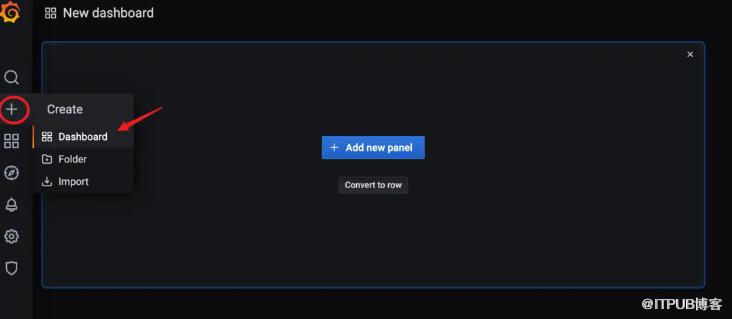 点击
点击+ Add new panel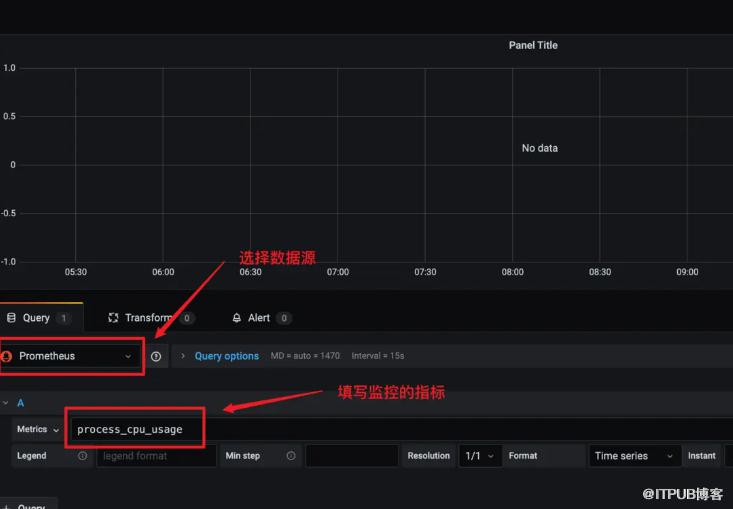
最终效果如下

五、引用
https://segmentfault.com/a/1190000040239129
http://www.liuhaihua.cn/archives/710215.html
原文作者:HBLOG;如有侵权,请联系管理员删除。

