「OBD 单机部署上手体验」:一步一步试玩 OBD 交互式部署,OceanBase 单机版搭建
(含命令 / 截图 / 避坑)
个人简介
作者: ShunWah
公众号: “顺华星辰运维栈”主理人。持有认证: OceanBase OBCA/OBCP、MySQL OCP、OpenGauss、崖山 DBCA、亚信 AntDBCA、翰高 HDCA、GBase 8a | 8c | 8s、Galaxybase GBCA、Neo4j Graph Data Science Certification、NebulaGraph NGCI & NGCP、东方通 TongTech TCPE 等多项权威认证。
获奖经历: 在OceanBase&墨天轮征文大赛、OpenGauss、TiDB、YashanDB、Kingbase、KWDB 征文等赛事中多次斩获一、二、三等奖,原创技术文章常年被墨天轮、CSDN、ITPUB 等平台首页推荐。
- 公众号_ID:顺华星辰运维栈
- CSDN_ID: shunwahma
- OB社区_ID:shunwah
- 墨天轮_ID:shunwah
- ITPUB_ID: shunwah
- IFClub_ID:shunwah

前言:OBD 交互式部署 OceanBase 单机版的价值与本文定位
OceanBase 作为蚂蚁集团自研的分布式关系型数据库,凭借高可用、高扩展、高性能的特性,已广泛应用于金融、电商、政务等核心业务场景。而 OBD(OceanBase Deployer) 作为 OceanBase 官方推出的部署与运维工具,极大简化了数据库的安装、配置与管理流程——尤其是 OBD 3.5.0 版本,不仅支持可视化“白屏部署”,还保留了灵活的“交互式部署”模式,满足不同用户的操作习惯。
对于习惯命令行操作的开发者或运维人员而言,交互式部署通过向导式参数输入,既能自主控制配置细节(如资源分配、存储路径、监控组件选型),又能实时反馈配置合法性,避免因参数错误导致部署失败。本文将以 OceanBase 单机版部署 为核心,从“启动部署向导”到“集群验证”,再到“日常运维命令”,全程拆解交互式部署的每一步操作,同步提供实操截图与关键注意事项,同时补充常见问题解决方案,帮助读者不仅“会操作”,更能“懂原理、能排错”,为后续搭建分布式集群或生产环境部署打下基础。
一、使用 OBD 交互式部署单机版
上一章学习了白屏web界面引领OceanBase部署新纪元:告别命令行,拥抱可视化操作,参考链接: 「OBD 单机部署上手体验」告别命令行!OBD 白屏界面轻松部署 OceanBase。本章继续学习交互式部署的核心是通过命令行向导引导用户逐步输入参数,无需提前编写配置文件,适合需要灵活调整部署细节的场景(如自定义数据存储路径、按需分配 CPU/内存资源、选择性安装监控组件)。整个流程可分为“启动向导→配置参数→确认部署→集群验证”四大环节,以下为详细实操步骤。
1. 启动交互式部署向导
首先需执行 OBD 集群部署命令,并通过
-i 参数启用交互式模式(
-i 是
--interactive 的缩写,明确指定“向导式输入”)。命令中“ob_single_cli”为自定义集群名,建议根据业务场景命名(如“ob_test_cli”“ob_dev_single”),便于后续管理多个集群时区分。
obd cluster deploy -i ob_single_cli # "ob_single_cli" 为自定义集群名,可按需修改
(1)IP 地址配置
执行命令后,向导首先会提示输入部署节点的 IP 地址,默认显示当前服务器的内网 IP(如示例中的 127.0.0.1)。若部署节点就是当前服务器,直接按 Enter 键使用默认值即可;若需部署到远程服务器,则输入目标服务器的公网/内网 IP(需确保当前机器与目标机器网络互通,且开放 SSH 端口)。
[root@worker3 obd350]# obd cluster deploy -i ob_single_cli
Enter the IP (Default: 127.0.0.1):

(2)用户密码验证
确认 IP 后,向导会检测当前登录用户(示例中为 root),并提示“不建议在生产环境使用 root 用户部署”——这是因为 root 用户权限过高,存在误操作风险,生产环境建议创建专用运维用户(如“admin”)并赋予必要权限。此处按提示输入当前用户(root)的密码,完成服务器登录验证(密码输入时默认不显示,输入后按 Enter 即可)。
[root@worker3 obd350]# obd cluster deploy -i ob_single_cli
Enter the IP (Default: 127.0.0.1):
The current user is root. It is not recommended to use root user for deployment in production environment
Enter the current user password:

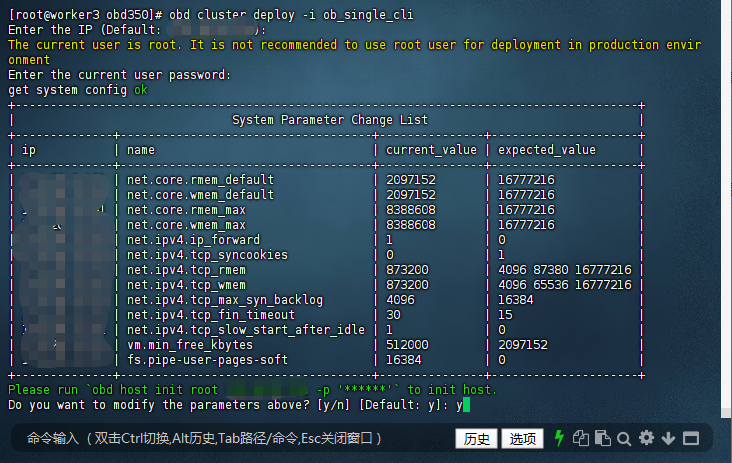
(3)系统参数检查与初始化提示
密码验证通过后,OBD 会自动检查当前服务器的系统参数(如网络、内存、文件系统配置),并对比 OceanBase 推荐的参数值,生成“系统参数修改列表”。示例中显示“net.core.rmem_default”当前值为 2097152,推荐值为 16777216,这类参数主要影响数据库的网络传输性能与内存管理效率。
向导会提示“执行
obd host init 命令初始化主机”,并询问是否修改上述参数(默认选择“y”)。若选择“y”,OBD 会自动帮你调整参数;若选择“n”,则需后续手动修改(不建议,可能导致部署失败或数据库运行异常)。
[root@worker3 obd350]# obd cluster deploy -i ob_single_cli
Enter the IP (Default: 127.0.0.1):
The current user is root. It is not recommended to use root user for deployment in production environment
Enter the current user password:
get system config ok
+-----------------------------------------------------------------------------------------+
|                               System Parameter Change List                              |
+--------------+------------------------------------+---------------+---------------------+
| ip           | name                               | current_value | expected_value      |
+--------------+------------------------------------+---------------+---------------------+
| 127.0.0.1 | net.core.rmem_default              | 2097152       | 16777216            |
| 127.0.0.1 | net.core.wmem_default              | 2097152       | 16777216            |
| 127.0.0.1 | net.core.rmem_max                  | 8388608       | 16777216            |
| 127.0.0.1 | net.core.wmem_max                  | 8388608       | 16777216            |
| 127.0.0.1 | net.ipv4.ip_forward                | 1             | 0                   |
| 127.0.0.1 | net.ipv4.tcp_syncookies            | 0             | 1                   |
| 127.0.0.1 | net.ipv4.tcp_rmem                  | 873200        | 4096 87380 16777216 |
| 127.0.0.1 | net.ipv4.tcp_wmem                  | 873200        | 4096 65536 16777216 |
| 127.0.0.1 | net.ipv4.tcp_max_syn_backlog       | 4096          | 16384               |
| 127.0.0.1 | net.ipv4.tcp_fin_timeout           | 30            | 15                  |
| 127.0.0.1 | net.ipv4.tcp_slow_start_after_idle | 1             | 0                   |
| 127.0.0.1 | vm.min_free_kbytes                 | 512000        | 2097152             |
| 127.0.0.1 | fs.pipe-user-pages-soft            | 16384         | 0                   |
+--------------+------------------------------------+---------------+---------------------+
Please run `obd host init root 127.0.0.1 -p '******'` to init host.
Do you want to modify the parameters above? [y/n] [Default: y]:
完成系统参数确认后,将进入核心的“部署参数配置”环节,需根据业务需求设置数据库版本、节点信息、资源分配等关键配置。
2. 按向导配置参数(关键步骤)
这一环节是交互式部署的核心,所有参数直接影响 OceanBase 集群的运行性能与稳定性。以下按配置顺序拆解每一步的意义与操作建议。
(1)选择数据库版本
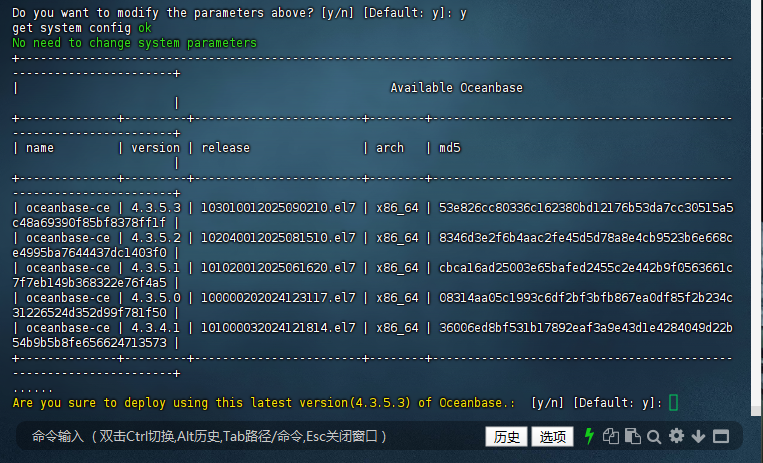
OBD 会自动列出当前可下载的 OceanBase 版本(默认优先显示最新稳定版),示例中最新版本为 4.3.5.3(2025 年 9 月 2 日发布)。若需指定版本(如生产环境常用的 4.2.1 稳定版),可手动输入版本号;若直接按 Enter 键,将使用默认推荐的最新版。
选择版本后,向导会询问“是否确认使用该版本部署”,默认选择“y”(建议确认版本兼容性,如应用依赖特定版本的 SQL 语法,需选择对应版本)。
Please input the oceanbase version [3.1.4]:  # 直接回车使用默认版本(示例中默认后续更新为4.3.5.3)No need to change system parameters
+-----------------------------------------------------------------------------------------------------------------------------+
|                                                     Available Oceanbase                                                     |
+--------------+---------+------------------------+--------+------------------------------------------------------------------+
| name         | version | release                | arch   | md5                                                              |
+--------------+---------+------------------------+--------+------------------------------------------------------------------+
| oceanbase-ce | 4.3.5.3 | 103010012025090210.el7 | x86_64 | 53e826cc80336c162380bd12176b53da7cc30515a5c48a69390f85bf8378ff1f |
| oceanbase-ce | 4.3.5.2 | 102040012025081510.el7 | x86_64 | 8346d3e2f6b4aac2fe45d5d78a8e4cb9523b6e668ce4995ba7644437dc1403f0 |
| oceanbase-ce | 4.3.5.1 | 101020012025061620.el7 | x86_64 | cbca16ad25003e65bafed2455c2e442b9f0563661c7f7eb149b368322e76f4a5 |
| oceanbase-ce | 4.3.5.0 | 100000202024123117.el7 | x86_64 | 08314aa05c1993c6df2bf3bfb867ea0df85f2b234c31226524d352d99f781f50 |
| oceanbase-ce | 4.3.4.1 | 101000032024121814.el7 | x86_64 | 36006ed8bf531b17892eaf3a9e43d1e4284049d22b54b9b5b8fe656624713573 |
+--------------+---------+------------------------+--------+------------------------------------------------------------------+
......
Are you sure to deploy using this latest version(4.3.5.3) of Oceanbase.:  [y/n] [Default: y]:
(2)配置节点与端口信息
单机部署场景下,节点列表默认是“127.0.0.1:2881”(127.0.0.1 为本地回环地址,2881 为 OceanBase 的 SQL 服务端口),直接按 Enter 键确认即可。若后续需扩展为分布式集群,此处需输入多个节点的“IP:端口”(用逗号分隔)。
随后向导会提示配置 3 个关键端口与 root 密码:
- OB SQL 端口(默认 2881):用于客户端(如 obclient、MySQL 客户端)连接数据库;
- OB RPC 端口(默认 2882):用于集群内节点间通信(单机部署也需保留,为后续扩展做准备);
- obshell 端口(默认 2886):用于通过 obshell 工具管理 OceanBase(如执行备份、恢复命令);
- OB root 密码(默认生成随机密码):系统租户(sys)的 root 用户密码,建议手动设置复杂密码(如包含大小写、数字、特殊符号),避免使用默认密码(示例中默认密码为 GkVhFJClHO419jbTbjo7,生产环境需修改)。
Please input the server list [127.0.0.1:2881]: # 单机部署默认本地地址,回车确认
Are you sure to deploy using this latest version(4.3.5.3) of Oceanbase.:  [y/n] [Default: y]: y
Enter the OB SQL port (Default: 2881):
Enter the OB RPC port (Default: 2882):
Enter the obshell port (Default: 2886):
Enter the OB root password (Default: GkVhFJClHO419jbTbjo7):

(3)配置系统租户资源
OceanBase 中的“租户”是资源隔离的基本单位, 系统租户(sys) 负责管理整个集群(如创建业务租户、分配资源),需为其分配 CPU 与内存资源:
- 系统租户内存(默认 2G):建议根据服务器总内存调整,如 8G 内存服务器可分配 2G,16G 内存服务器可分配 4G(内存不足会导致系统租户启动失败);
- 系统租户 CPU 核数(默认 2):建议不低于 2 核,若服务器 CPU 核数较少(如 4 核),可保持默认值;若为 8 核及以上,可适当增加(如 4 核),提升系统租户的管理效率。
示例中向导还提示配置“OB 总 CPU 数”(默认 8)与“OB 内存限制”(默认 13G, configurable range 6-13G),这是整个 OceanBase 实例可使用的总资源(包含系统租户与后续创建的业务租户),需根据服务器硬件配置调整——如 8 核 16G 服务器,可设置“CPU 数 8”“内存限制 8G”(预留部分内存给操作系统与其他服务)。
# 系统租户内存大小(默认 2G)Please input the observer system tenant memory size [2G]:
# 系统租户 CPU 核数(默认 2)Please input the observer system tenant cpu number [2]:
Enter the OB cpu count (Default: 8):
Enter the OB memory limit (Configurable Range[6, 13], Default: 13, Unit: G): 8

(4)配置数据与日志存储路径
OceanBase 的数据(如用户表、索引)与日志(如事务日志、运行日志)需存储在独立路径,默认路径为“/home/admin/oceanbase/data”(数据)与“/data/log1/ob_single_cli”(日志)。建议根据服务器磁盘布局修改路径,遵循以下原则:
- 数据路径与日志路径尽量分开存储(如分别挂载在不同磁盘),避免 I/O 竞争;
- 路径需为 绝对路径(示例中用户输入“data/ob43”被提示错误,需改为“/data/ob43”);
- 确保路径所在磁盘有足够空间(建议数据盘不小于 20G,日志盘不小于 16G)。
示例中用户将“OB 安装目录”修改为“/data/ob43”(存储 OceanBase 程序文件),数据路径与日志路径使用默认值(也可根据实际情况调整)。
Please input the data_dir [/home/admin/oceanbase/data]: /data/ob/data # 自定义路径(示例中用户后续调整为默认绝对路径)
Enter the OB installation directory (Default: /root/ob_single_cli): /data/ob43
Enter the OB data directory (Default: /data/1/ob_single_cli): data/ob43
The directory must be an absolute path. Please try again.
Enter the OB data directory (Default: /data/1/ob_single_cli):
Enter the OB log directory (Default: /data/log1/ob_single_cli):

(5)选择集群优化场景
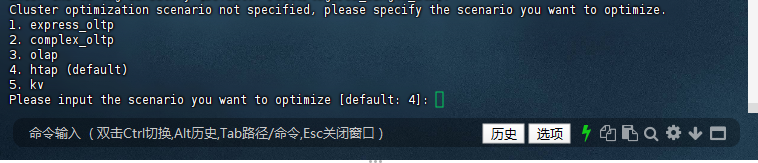
OceanBase 支持多种业务场景的优化配置,向导会列出 5 种场景供选择:
- express_oltp:轻量 OLTP(在线事务处理),适合并发量较低的简单事务场景(如小型电商订单系统);
- complex_oltp:复杂 OLTP,适合高并发、复杂事务场景(如金融核心交易系统);
- olap:OLAP(在线分析处理),适合大数据量分析查询场景(如报表统计、数据挖掘);
- htap(默认):混合事务/分析处理,兼顾 OLTP 与 OLAP 场景(如实时数据分析业务);
- kv:键值存储场景,适合以键值查询为主的业务(如缓存、配置存储)。
需根据业务类型选择,示例中选择默认的“htap”场景(若不确定业务场景,选择 htap 是稳妥的选择)。
Cluster optimization scenario not specified, please specify the scenario you want to optimize.
1. express_oltp
2. complex_oltp
3. olap
4. htap (default)
5. kv
Please input the scenario you want to optimize [default: 4]:
(6)配置日志磁盘与数据文件大小
接下来需设置日志磁盘大小与数据文件最大容量:
- 日志磁盘大小(默认 22G,范围 16-22G):存储事务日志(clog),日志磁盘不足会导致事务无法提交,建议设置为 16-22G(示例中用户设置为 16G);
- 数据文件最大容量(默认 102G,范围 16-102G):存储用户数据,超过该容量后需扩展磁盘或清理数据,示例中用户设置为 22G(测试环境可适当减小,生产环境需根据数据量预估)。
Enter the log disk size (Configurable Range[16, 22], Default: 22 , unit: G): 16
Enter the datafile maxsize (Configurable Range[16, 102], Default: 102 , unit: G): 22

(7)创建业务租户(可选)
系统租户(sys)仅用于集群管理,业务数据需存储在 业务租户中。向导会询问“是否创建业务租户”,默认选择“y”(建议创建,避免直接使用系统租户存储业务数据,保证资源隔离与数据安全)。
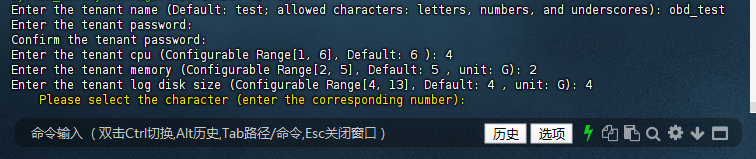
创建业务租户需配置以下参数:
- 租户名称(默认 test):建议根据业务命名(如“obd_test”“order_tenant”),仅支持字母、数字与下划线;
- 租户密码:业务租户 root 用户的密码,需与系统租户密码区分,建议设置复杂密码(示例中用户设置为“caip2018!”);
- 租户 CPU(默认 6 核,范围 1-6 核):根据业务并发量分配,示例中用户设置为 4 核;
- 租户内存(默认 5G,范围 2-5G):需小于 OB 总内存限制,示例中用户设置为 2G;
- 租户日志磁盘(默认 4G,范围 4-13G):存储业务租户的事务日志,示例中用户设置为 4G。
Do you want to create tenant for your business workload? [y/n] [Default: y]: y
Tenant: sys conifguration: 2C/2G/3G(CPU/Memory/Log disk)
system_memory configuration(Unit: G): 1G
Enter the tenant name (Default: test; allowed characters: letters, numbers, and underscores): obd_test
Enter the tenant password:
Confirm the tenant password:
Enter the tenant cpu (Configurable Range[1, 6], Default: 6 ): 4
Enter the tenant memory (Configurable Range[2, 5], Default: 5 , unit: G): 2
Enter the tenant log disk size (Configurable Range[4, 13], Default: 4 , unit: G): 4
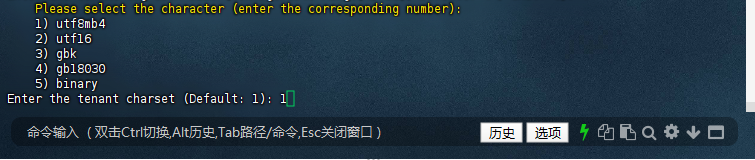
    Please select the character (enter the corresponding number):
(8)配置租户字符集、排序规则与时区
业务租户创建后,需设置字符集、排序规则与时区,确保与应用程序兼容:
- 字符集(默认 utf8mb4):支持 emoji 表情与多语言,是当前主流选择(其他选项如 gbk 适合中文场景,但兼容性不如 utf8mb4);
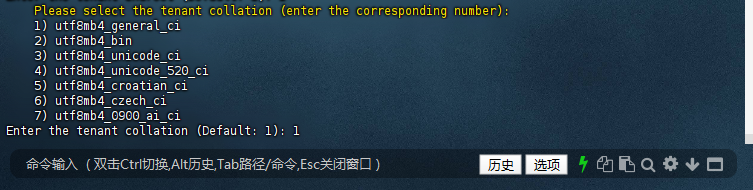
- 排序规则(默认 utf8mb4_general_ci):ci 表示“不区分大小写”,适合大多数业务;若需区分大小写,可选择“utf8mb4_bin”;
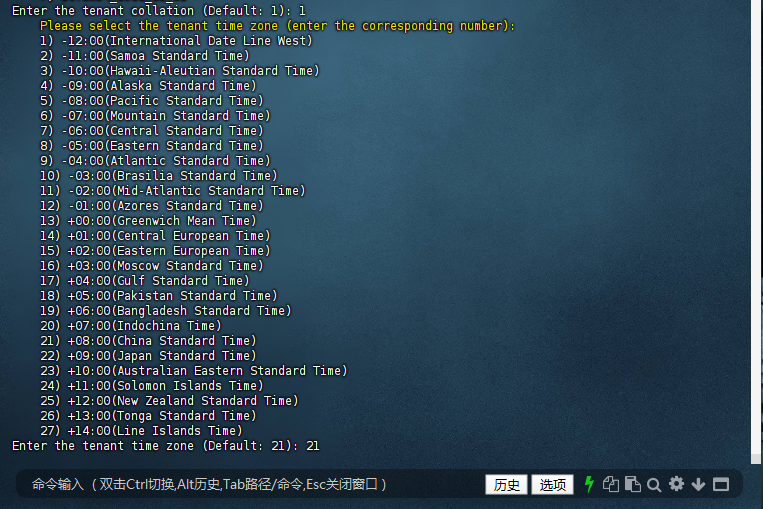
- 时区(默认 +08:00 中国标准时间):需与应用程序时区一致,避免时间字段计算错误(示例中选择默认的 21 号选项“+08:00”)。
此外,向导还会询问“表名大小写敏感性”,默认选择“1”(表名存储为小写,查询时不区分大小写),符合大多数用户的使用习惯;若需严格区分大小写,可选择“0”。
    Please select the character (enter the corresponding number):
    1) utf8mb4
    2) utf16
    3) gbk
    4) gb18030
    5) binary
Enter the tenant charset (Default: 1): 1
    Please select the tenant collation (enter the corresponding number):
    1) utf8mb4_general_ci
    2) utf8mb4_bin
    3) utf8mb4_unicode_ci
    4) utf8mb4_unicode_520_ci
    5) utf8mb4_croatian_ci
    6) utf8mb4_czech_ci
    7) utf8mb4_0900_ai_ci
Enter the tenant collation (Default: 1):
Please select the tenant time zone (enter the corresponding number):
    1) -12:00(International Date Line West)
    2) -11:00(Samoa Standard Time)
    3) -10:00(Hawaii-Aleutian Standard Time)
    4) -09:00(Alaska Standard Time)
    5) -08:00(Pacific Standard Time)
    6) -07:00(Mountain Standard Time)
    7) -06:00(Central Standard Time)
    8) -05:00(Eastern Standard Time)
    9) -04:00(Atlantic Standard Time)
    10) -03:00(Brasilia Standard Time)
    11) -02:00(Mid-Atlantic Standard Time)
    12) -01:00(Azores Standard Time)
    13) +00:00(Greenwich Mean Time)
    14) +01:00(Central European Time)
    15) +02:00(Eastern European Time)
    16) +03:00(Moscow Standard Time)
    17) +04:00(Gulf Standard Time)
    18) +05:00(Pakistan Standard Time)
    19) +06:00(Bangladesh Standard Time)
    20) +07:00(Indochina Time)
    21) +08:00(China Standard Time)
    22) +09:00(Japan Standard Time)
    23) +10:00(Australian Eastern Standard Time)
    24) +11:00(Solomon Islands Time)
    25) +12:00(New Zealand Standard Time)
    26) +13:00(Tonga Standard Time)
    27) +14:00(Line Islands Time)
Enter the tenant time zone (Default: 21):
    Please select case sensitivity for table names:
    0) Table names are stored as specified and compared case-sensitively
    1) Table names are stored in lowercase and compared case-insensitively
    2) Table names are stored as specified but compared case-insensitively
Please enter your choice [0/1/2] [default 1]:

(9)安装监控组件(可选)
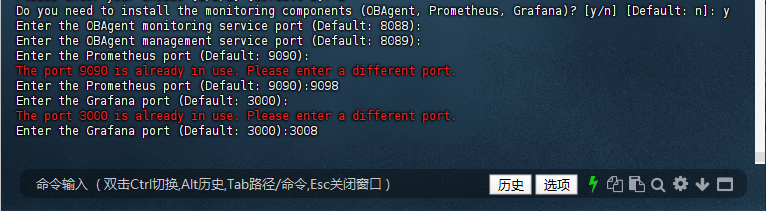
OceanBase 提供 OBAgent(监控数据采集)、Prometheus(监控数据存储与分析)、Grafana(监控面板可视化)三大监控组件,向导会询问“是否安装”,默认选择“n”。若需实时监控集群状态(如 CPU 使用率、内存占用、SQL 执行效率),建议选择“y”。
安装时需配置各组件的端口,若端口被占用(如默认的 Prometheus 9090 端口、Grafana 3000 端口),需修改为未占用的端口(示例中用户将 Prometheus 端口改为 9098,Grafana 端口改为 3008)。可通过
netstat -tuln | grep 端口号 命令提前检查端口是否被占用。
Do you need to install the monitoring components (OBAgent, Prometheus, Grafana)? [y/n] [Default: n]: y
Enter the OBAgent monitoring service port (Default: 8088):
Enter the OBAgent management service port (Default: 8089):
Enter the Prometheus port (Default: 9090):
The port 9090 is already in use. Please enter a different port.
Enter the Prometheus port (Default: 9090):9098
Enter the Grafana port (Default: 3000):
The port 3000 is already in use. Please enter a different port.
Enter the Grafana port (Default: 3000):3008
(10)确认配置并启动部署
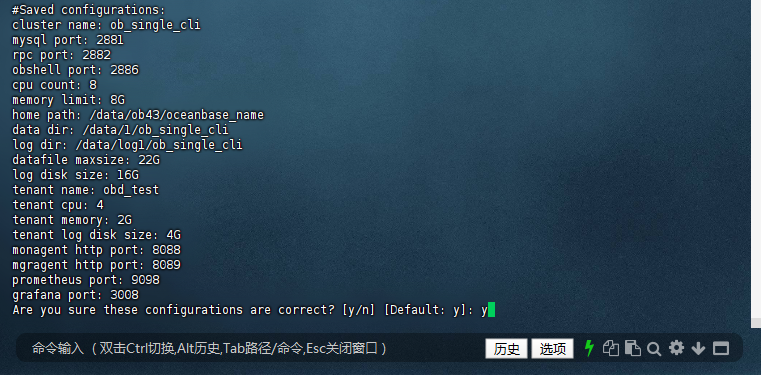
所有参数配置完成后,向导会列出完整的配置清单(如集群名、端口、资源分配、监控组件端口等),需仔细核对是否正确(尤其是密码、端口、存储路径,错误配置会导致部署失败或后续无法使用)。确认无误后输入“y”,OBD 会开始下载 OceanBase 安装包、初始化目录、配置组件,并启动部署流程。
#Saved configurations:
cluster name: ob_single_cli
mysql port: 2881
rpc port: 2882
obshell port: 2886
cpu count: 8
memory limit: 8G
home path: /data/ob43/oceanbase_name
data dir: /data/1/ob_single_cli
log dir: /data/log1/ob_single_cli
datafile maxsize: 22G
log disk size: 16G
tenant name: obd_test
tenant cpu: 4
tenant memory: 2G
tenant log disk size: 4G
monagent http port: 8088
mgragent http port: 8089
prometheus port: 9098
grafana port: 3008
Are you sure these configurations are correct? [y/n] [Default: y]:
(11)密码加密配置(可选)
向导最后会询问“是否启用密码加密”(默认加密密钥为 123456),默认选择“n”(测试环境可暂不启用,生产环境建议启用,提升密码安全性,需记住加密密钥,后续修改密码时需使用)。
Do you want to enable encryption for password security (default_encryption_passkey: 123456)? [y/n] [Default: n]: n

(12)部署过程与结果验证
确认后,OBD 会执行以下操作:
- 检查配置参数合法性;
- 下载指定版本的 OceanBase 与监控组件安装包;
- 初始化程序目录、数据目录与日志目录;
- 启动 observer(OceanBase 核心进程)、obshell、监控组件;
- 初始化系统租户与业务租户;
- 验证各组件健康状态(如 observer 进程是否存活、Grafana 是否可访问)。
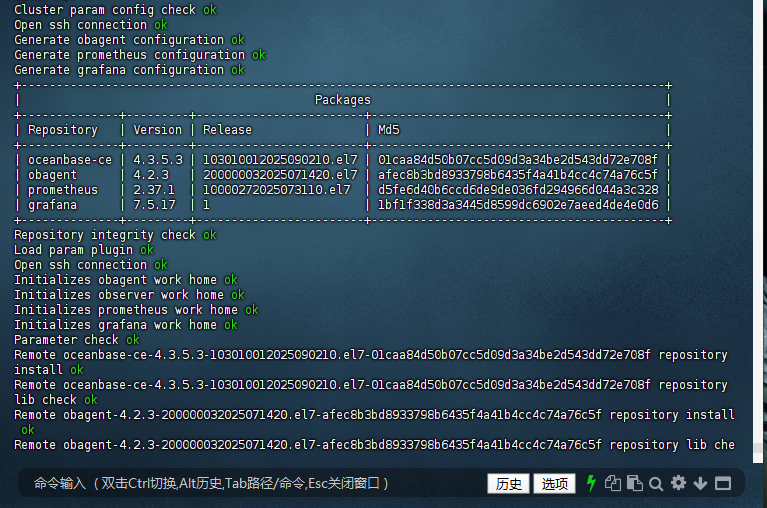
部署成功后,向导会输出集群信息(如 observer 节点状态、数据库连接命令、监控组件访问地址),示例中 observer 状态为“ACTIVE”,表示集群启动正常。
Cluster param config check ok
Open ssh connection ok
Generate obagent configuration ok
Generate prometheus configuration ok
Generate grafana configuration ok
+--------------------------------------------------------------------------------------------+
|                                          Packages                                          |
+--------------+---------+------------------------+------------------------------------------+
| Repository   | Version | Release                | Md5                                      |
+--------------+---------+------------------------+------------------------------------------+
| oceanbase-ce | 4.3.5.3 | 103010012025090210.el7 | 01caa84d50b07cc5d09d3a34be2d543dd72e708f |
| obagent      | 4.2.3   | 200000032025071420.el7 | afec8b3bd8933798b6435f4a41b4cc4c74a76c5f |
| prometheus   | 2.37.1  | 10000272025073110.el7  | d5fe6d40b6ccd6de9de036fd294966d044a3c328 |
| grafana      | 7.5.17  | 1                      | 1bf1f338d3a3445d8599dc6902e7aeed4de4e0d6 |
+--------------+---------+------------------------+------------------------------------------+
Repository integrity check ok
Load param plugin ok
Open ssh connection ok
Initializes obagent work home ok
Initializes observer work home ok
Initializes prometheus work home ok
Initializes grafana work home ok
Parameter check ok
Remote oceanbase-ce-4.3.5.3-103010012025090210.el7-01caa84d50b07cc5d09d3a34be2d543dd72e708f repository install ok
Remote oceanbase-ce-4.3.5.3-103010012025090210.el7-01caa84d50b07cc5d09d3a34be2d543dd72e708f repository lib check ok
Remote obagent-4.2.3-200000032025071420.el7-afec8b3bd8933798b6435f4a41b4cc4c74a76c5f repository install ok
Remote obagent-4.2.3-200000032025071420.el7-afec8b3bd8933798b6435f4a41b4cc4c74a76c5f repository lib check ok
Remote prometheus-2.37.1-10000272025073110.el7-d5fe6d40b6ccd6de9de036fd294966d044a3c328 repository install ok
Remote prometheus-2.37.1-10000272025073110.el7-d5fe6d40b6ccd6de9de036fd294966d044a3c328 repository lib check ok
Remote grafana-7.5.17-1-1bf1f338d3a3445d8599dc6902e7aeed4de4e0d6 repository install ok
Remote grafana-7.5.17-1-1bf1f338d3a3445d8599dc6902e7aeed4de4e0d6 repository lib check ok
ob_single_cli deployed
Get local repositories ok
Load cluster param plugin ok
Open ssh connection ok
[WARN] OBD-1012: (127.0.0.1) clog and data use the same disk (/data)
Check before start obagent ok
Check before start prometheus ok
Check before start grafana ok
cluster scenario: htap
Start observer ok
observer program health check ok
Connect to observer 127.0.0.1:2881 ok
oceanbase bootstrap ok
obshell start ok
obshell program health check ok
obshell bootstrap ok
Start obagent ok
obagent program health check ok
Send /root/.obd/repository/obagent/4.2.3/afec8b3bd8933798b6435f4a41b4cc4c74a76c5f/conf/prometheus_config/rules to /data/ob43/prometheus/rules ok
Start promethues ok
prometheus program health check ok
Start grafana ok
grafana program health check ok
Connect to grafana ok
Grafana modify password ok
Connect to observer 127.0.0.1:2881 ok
Wait for observer init ok
+------------------------------------------------+
|                  oceanbase-ce                  |
+--------------+---------+------+-------+--------+
| ip           | version | port | zone  | status |
+--------------+---------+------+-------+--------+
| 127.0.0.1 | 4.3.5.3 | 2881 | zone1 | ACTIVE |
+--------------+---------+------+-------+--------+
obclient -h127.0.0.1 -P2881 -uroot@sys -p'GkVhFJClHO419jbTbjo7' -Doceanbase -A
cluster unique id: 80d2e97d-af5d-5848-905b-0a81685afa8e-19918946bff-03050304
Connect to Obagent ok
+-----------------------------------------------------------------+
|                             obagent                             |
+--------------+--------------------+--------------------+--------+
| ip           | mgragent_http_port | monagent_http_port | status |
+--------------+--------------------+--------------------+--------+
| 127.0.0.1 | 8089               | 8088               | active |
+--------------+--------------------+--------------------+--------+
Connect to Prometheus ok
+----------------------------------------------------------+
|                        prometheus                        |
+--------------------------+-------+--------------+--------+
| url                      | user  | password     | status |
+--------------------------+-------+--------------+--------+
| http://127.0.0.1:9098 | admin | 'CCARlmzLVJ' | active |
+--------------------------+-------+--------------+--------+
Connect to grafana ok
+---------------------------------------------------------------------+
|                               grafana                               |
+--------------------------------------+-------+-------------+--------+
| url                                  | user  | password    | status |
+--------------------------------------+-------+-------------+--------+
| http://127.0.0.1:3008/d/oceanbase | admin | 'oceanbase' | active |
+--------------------------------------+-------+-------------+--------+
obshell program health check ok
display ob-dashboard ok
+-------------------------------------------------------------------+
|                            ob-dashboard                           |
+--------------------------+------+------------------------+--------+
| url                      | user | password               | status |
+--------------------------+------+------------------------+--------+
| http://127.0.0.1:2886 | root | 'GkVhFJClHO419jbTbjo7' | active |
+--------------------------+------+------------------------+--------+
ob_single_cli running
Get local repositories ok
Open ssh connection ok
Connect to observer 127.0.0.1:2881 ok
Create tenant obd_test ok
obclient -h127.0.0.1 -P'2881' -p'caip2018!' -uroot@obd_test -Doceanbase -A
optimize tenant with scenario: htap ok
See https://www.oceanbase.com/product/ob-deployer/error-codes .
Trace ID: 0f5b918c-8a1e-11f0-a0ea-0050568197df
If you want to view detailed obd logs, please run: obd display-trace 0f5b918c-8a1e-11f0-a0ea-0050568197df
[root@worker3 obd350]#
(13)查看部署日志(可选)
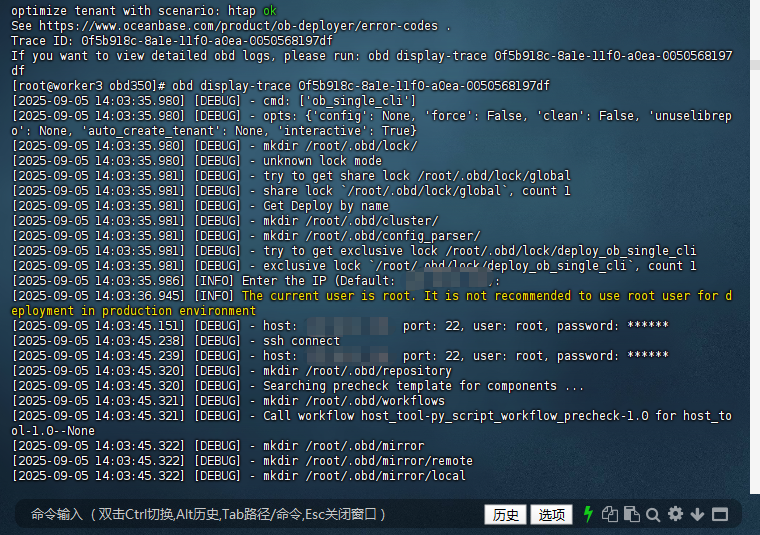
若部署过程中出现错误,可通过
obd display-trace 命令查看详细日志(日志中会标注错误原因,如“内存不足”“端口被占用”“权限不足”),示例中 Trace ID 为“0f5b918c-8a1e-11f0-a0ea-0050568197df”,执行以下命令即可查看日志:
[root@worker3 obd350]# obd display-trace 0f5b918c-8a1e-11f0-a0ea-0050568197df
3. 启动集群并验证
部署完成后,若集群未自动启动(示例中已自动启动,状态为“running”),需手动启动集群;随后通过“查看集群状态”“连接数据库”验证部署结果。
(1)启动集群
若集群未启动,执行以下命令(集群名需与部署时一致,示例为“ob_single_cli”):
obd cluster start ob_single_cli # 集群名与部署时一致
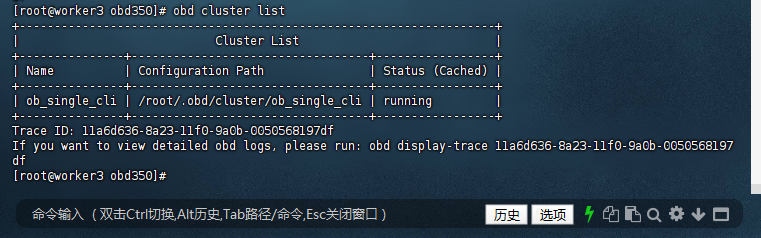
启动后,可通过
obd cluster list 命令查看所有集群的状态,示例中“ob_single_cli”的状态为“running”,表示集群已正常启动。
[root@worker3 obd350]# obd cluster list
+--------------------------------------------------------------------+
|                            Cluster List                            |
+---------------+----------------------------------+-----------------+
| Name          | Configuration Path               | Status (Cached) |
+---------------+----------------------------------+-----------------+
| ob_single_cli | /root/.obd/cluster/ob_single_cli | running         |
+---------------+----------------------------------+-----------------+
Trace ID: 11a6d636-8a23-11f0-9a0b-0050568197df
If you want to view detailed obd logs, please run: obd display-trace 11a6d636-8a23-11f0-9a0b-0050568197df
[root@worker3 obd350]#
(2)查看集群状态
执行
obd cluster status 集群名 命令,查看集群的详细状态(如节点 IP、版本、端口、租户状态)。若输出中“status”字段为“ACTIVE”或“running”,表示集群运行正常。
obd cluster status ob_single_cli# 输出中 "status" 为 "running" 或 "ACTIVE" 即成功
(3)连接数据库(验证可用性)
部署成功后,可通过
obclient(OceanBase 官方客户端)或
mysql 客户端连接数据库。以下为两种连接方式的示例(需替换为实际的 IP、端口与密码):
(3.1):使用 mysql 客户端连接系统租户
若服务器已安装 MySQL 客户端,可直接使用以下命令连接(OceanBase 兼容 MySQL 协议):
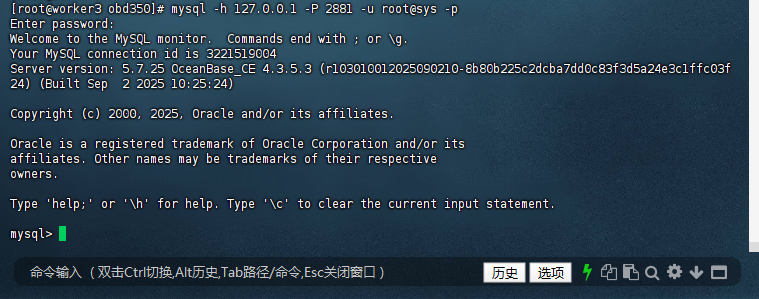
mysql -h 127.0.0.1 -P 2881 -u root@sys -p
输入密码后,若出现“Welcome to the MySQL monitor”提示,且显示 OceanBase 版本信息(示例中为 4.3.5.3),表示数据库连接成功,可正常执行 SQL 命令(如
show databases; 查看数据库列表)。
[root@worker3 obd350]# mysql -h 127.0.0.1 -P 2881 -u root@sys -p
Enter password:
Welcome to the MySQL monitor.  Commands end with ; or \g.
Your MySQL connection id is 3221519004
Server version: 5.7.25 OceanBase_CE 4.3.5.3 (r103010012025090210-8b80b225c2dcba7dd0c83f3d5a24e3c1ffc03f24) (Built Sep  2 2025 10:25:24)
Copyright (c) 2000, 2025, Oracle and/or its affiliates.
Oracle is a registered trademark of Oracle Corporation and/or its
affiliates. Other names may be trademarks of their respective
owners.
Type 'help;' or '\h' for help. Type '\c' to clear the current input statement.
mysql>
同理,可连接业务租户(如“obd_test”),验证业务租户的可用性:
mysql -h 127.0.0.1 -P 2881 -u root@obd_test -p'caip2018!'
二、OBD 常用命令汇总
OBD 提供了一套完整的集群管理命令,覆盖“部署→启动→运维→销毁”全生命周期。掌握以下命令,可轻松应对 OceanBase 集群的日常管理需求,避免因操作不熟悉导致的运维效率低下或误操作。
| 功能 | 命令示例 | 说明与使用场景 |
|---|---|---|
| 查看集群列表 |
obd cluster list |
显示所有已部署的集群名称、配置文件路径与状态(如“running”“stopped”“configured”),忘记集群名时必用。 |
| 启动集群 |
obd cluster start 集群名 |
如
obd cluster start ob_single_web,用于集群停止后重新启动(需确保集群已部署且配置无误)。 |
| 停止集群 |
obd cluster stop 集群名 |
优雅停止集群(先关闭业务连接,再停止进程,避免数据丢失),适合维护、升级前使用。 |
| 重启集群 |
obd cluster restart 集群名 |
先执行“停止集群”,再自动执行“启动集群”,适合修改配置后需重启生效的场景(如调整内存参数)。 |
| 查看集群状态 |
obd cluster status 集群名 或
obd cluster display 集群名 |
显示集群节点、进程、资源使用、租户状态等详细信息,用于日常巡检或故障排查(确认集群是否正常运行)。 |
| 销毁集群 |
obd cluster destroy 集群名 |
彻底删除集群(包括程序文件、数据、配置), 生产环境需谨慎操作(建议先备份数据,仅测试环境使用)。 |
| 查看部署日志 |
obd cluster log 集群名 |
输出集群部署或运行过程中的日志,用于定位部署失败(如“端口被占”“权限不足”)或运行异常的原因。 |
| 检查集群健康度 |
obd cluster check 集群名 |
自动检测系统参数、资源(CPU/内存/磁盘)、服务状态是否符合 OceanBase 运行要求,提前发现潜在风险。 |
1. 查看集群列表(
obd cluster list)
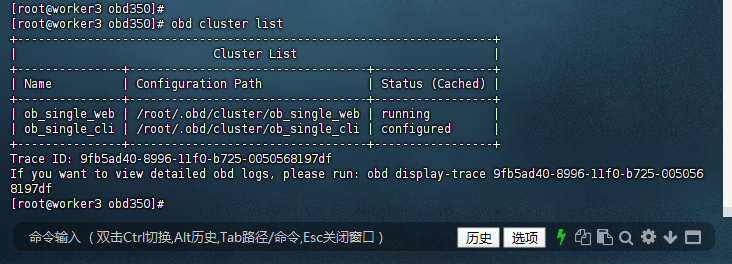
该命令是运维的“入口”,可快速了解当前服务器上所有 OceanBase 集群的基本信息,避免因集群名过多导致混淆。示例中显示两个集群:“ob_single_web”(状态 running)与“ob_single_cli”(状态 configured,未启动)。
[root@worker3 obd350]# obd cluster list
+--------------------------------------------------------------------+
|                            Cluster List                            |
+---------------+----------------------------------+-----------------+
| Name          | Configuration Path               | Status (Cached) |
+---------------+----------------------------------+-----------------+
| ob_single_web | /root/.obd/cluster/ob_single_web | running         |
| ob_single_cli | /root/.obd/cluster/ob_single_cli | configured      |
+---------------+----------------------------------+-----------------+
Trace ID: 9fb5ad40-8996-11f0-b725-0050568197df
If you want to view detailed obd logs, please run: obd display-trace 9fb5ad40-8996-11f0-b725-0050568197df
[root@worker3 obd350]#
2. 启动集群(
obd cluster start 集群名)
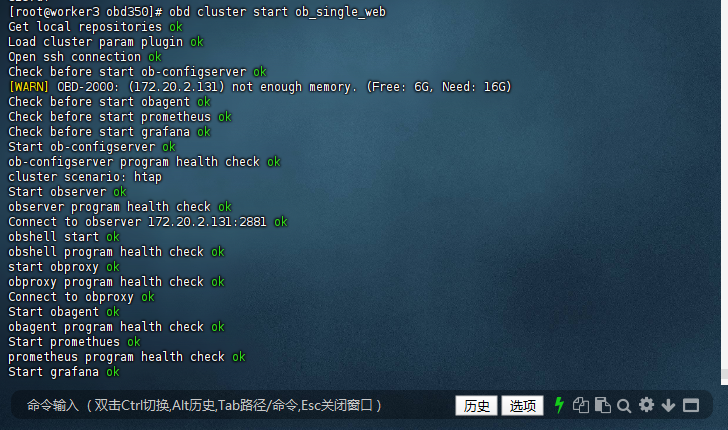
若集群状态为“stopped”或“configured”,需执行该命令启动。启动过程中,OBD 会检查依赖组件(如 ob-configserver、obproxy)状态,确保所有组件正常启动。示例中启动“ob_single_web”集群,过程中提示“内存不足”(Free: 6G,Need: 16G),属于警告(测试环境可忽略,生产环境需扩容),最终集群启动成功。
[root@worker3 obd350]# obd cluster start ob_single_web
Get local repositories ok
Load cluster param plugin ok
Open ssh connection ok
Check before start ob-configserver ok
[WARN] OBD-2000: (127.0.0.1) not enough memory. (Free: 6G, Need: 16G)
Check before start obagent ok
Check before start prometheus ok
Check before start grafana ok
Start ob-configserver ok
ob-configserver program health check ok
cluster scenario: htap
Start observer ok
observer program health check ok
Connect to observer 127.0.0.1:2881 ok
obshell start ok
obshell program health check ok
start obproxy ok
obproxy program health check ok
Connect to obproxy ok
Start obagent ok
obagent program health check ok
Start promethues ok
prometheus program health check ok
Start grafana ok
grafana program health check ok
Connect to grafana ok
Grafana modify password ok
Connect to ob-configserver ok
+----------------------------------------------------------------+
|                        ob-configserver                         |
+--------------+------+--------------+----------+--------+-------+
| server       | port | vip_address  | vip_port | status | pid   |
+--------------+------+--------------+----------+--------+-------+
| 127.0.0.1 | 8087 | 127.0.0.1 | 8087     | active | 23436 |
+--------------+------+--------------+----------+--------+-------+
curl -s 'http://127.0.0.1:8087/services?Action=GetObProxyConfig'
Connect to observer 127.0.0.1:2881 ok
Wait for observer init ok
+------------------------------------------------+
|                  oceanbase-ce                  |
+--------------+---------+------+-------+--------+
| ip           | version | port | zone  | status |
+--------------+---------+------+-------+--------+
| 127.0.0.1 | 4.3.5.3 | 2881 | zone1 | ACTIVE |
+--------------+---------+------+-------+--------+
obclient -h127.0.0.1 -P2881 -uroot@sys -p'T+%p=A;c8:AupMI' -Doceanbase -A
cluster unique id: b2c119ba-9aa0-5ab1-9712-2d932b6f2a99-199142cc4de-03050304
Connect to obproxy ok
+------------------------------------------------------------------+
|                            obproxy-ce                            |
+--------------+------+-----------------+-----------------+--------+
| ip           | port | prometheus_port | rpc_listen_port | status |
+--------------+------+-----------------+-----------------+--------+
| 127.0.0.1 | 2883 | 2884            | 2885            | active |
+--------------+------+-----------------+-----------------+--------+
obclient -h127.0.0.1 -P2883 -uroot@proxysys -p'y6e)0l0)RnU=~eS' -Doceanbase -A
Connect to Obagent ok
+-----------------------------------------------------------------+
|                             obagent                             |
+--------------+--------------------+--------------------+--------+
| ip           | mgragent_http_port | monagent_http_port | status |
+--------------+--------------------+--------------------+--------+
| 127.0.0.1 | 8089               | 8088               | active |
+--------------+--------------------+--------------------+--------+
Connect to Prometheus ok
+-------------------------------------------------------------------+
|                             prometheus                            |
+--------------------------+-------+-----------------------+--------+
| url                      | user  | password              | status |
+--------------------------+-------+-----------------------+--------+
| http://127.0.0.1:9098 | admin | 'P&Gct0Z6j,?_OvFc%c[' | active |
+--------------------------+-------+-----------------------+--------+
Connect to grafana ok
+------------------------------------------------------------------------------------+
|                                      grafana                                       |
+--------------------------------------+-------+----------------------------+--------+
| url                                  | user  | password                   | status |
+--------------------------------------+-------+----------------------------+--------+
| http://127.0.0.1:3008/d/oceanbase | admin | 'Ar1=wj-?[NgX)kP.5XKjSHBE' | active |
+--------------------------------------+-------+----------------------------+--------+
obshell program health check ok
display ob-dashboard ok
+--------------------------------------------------------------+
|                         ob-dashboard                         |
+--------------------------+------+-------------------+--------+
| url                      | user | password          | status |
+--------------------------+------+-------------------+--------+
| http://127.0.0.1:2886 | root | 'T+%p=A;c8:AupMI' | active |
+--------------------------+------+-------------------+--------+
ob_single_web running
Trace ID: fbab925e-8996-11f0-ad32-0050568197df
If you want to view detailed obd logs, please run: obd display-trace fbab925e-8996-11f0-ad32-0050568197df
[root@worker3 obd350]#
3. 停止集群(
obd cluster stop 集群名)
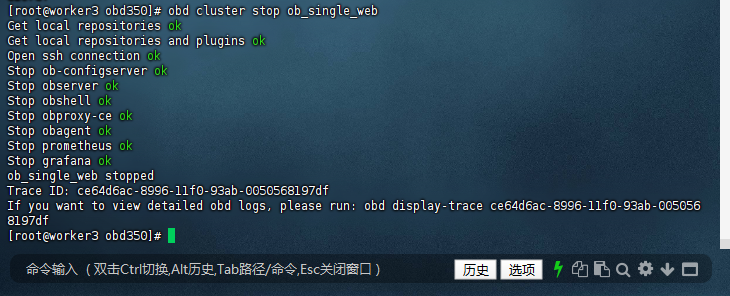
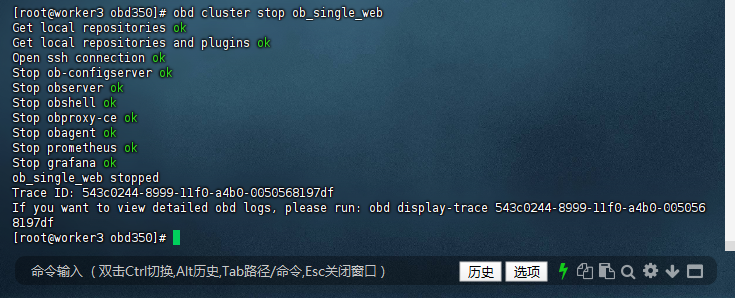
停止集群是“安全操作”,OBD 会先关闭业务连接(避免事务中断导致数据不一致),再依次停止 observer、obproxy、监控组件等进程。示例中停止“ob_single_web”集群,所有组件均停止成功,最终状态变为“stopped”。
[root@worker3 obd350]# obd cluster stop ob_single_web
Get local repositories ok
Get local repositories and plugins ok
Open ssh connection ok
Stop ob-configserver ok
Stop observer ok
Stop obshell ok
Stop obproxy-ce ok
Stop obagent ok
Stop prometheus ok
Stop grafana ok
ob_single_web stopped
Trace ID: ce64d6ac-8996-11f0-93ab-0050568197df
If you want to view detailed obd logs, please run: obd display-trace ce64d6ac-8996-11f0-93ab-0050568197df
[root@worker3 obd350]#
4. 重启集群(
obd cluster restart 集群名)
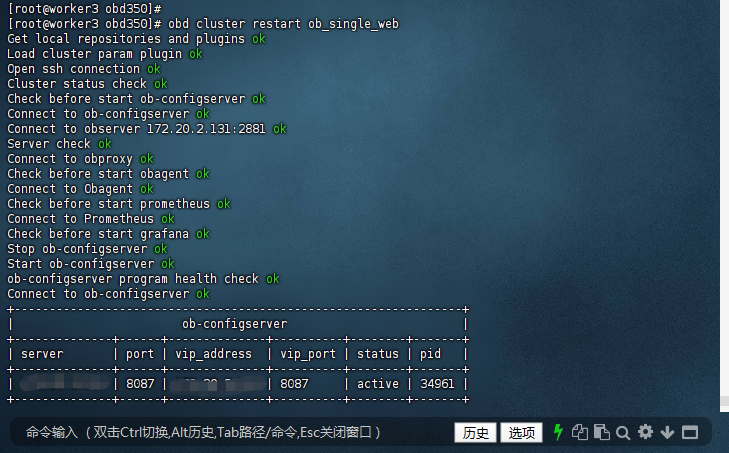
修改集群配置(如调整内存、CPU 资源)后,需重启集群使配置生效。重启过程是“停止→启动”的自动化流程,无需手动执行两步操作。示例中重启“ob_single_web”集群,最终所有组件均恢复为“active”状态,配置修改生效。
[root@worker3 obd350]# obd cluster restart ob_single_web
Get local repositories and plugins ok
Load cluster param plugin ok
Open ssh connection ok
Cluster status check ok
Check before start ob-configserver ok
Connect to ob-configserver ok
Connect to observer 127.0.0.1:2881 ok
Server check ok
Connect to obproxy ok
Check before start obagent ok
Connect to Obagent ok
Check before start prometheus ok
Connect to Prometheus ok
Check before start grafana ok
Stop ob-configserver ok
Start ob-configserver ok
ob-configserver program health check ok
Connect to ob-configserver ok
+----------------------------------------------------------------+
|                        ob-configserver                         |
+--------------+------+--------------+----------+--------+-------+
| server       | port | vip_address  | vip_port | status | pid   |
+--------------+------+--------------+----------+--------+-------+
| 127.0.0.1 | 8087 | 127.0.0.1 | 8087     | active | 34961 |
+--------------+------+--------------+----------+--------+-------+
curl -s 'http://127.0.0.1:8087/services?Action=GetObProxyConfig'
Stop observer ok
Stop obshell ok
cluster scenario: htap
Start observer ok
observer program health check ok
obshell start ok
obshell program health check ok
Connect to observer 127.0.0.1:2881 ok
Wait for observer init ok
+------------------------------------------------+
|                  oceanbase-ce                  |
+--------------+---------+------+-------+--------+
| ip           | version | port | zone  | status |
+--------------+---------+------+-------+--------+
| 127.0.0.1 | 4.3.5.3 | 2881 | zone1 | ACTIVE |
+--------------+---------+------+-------+--------+
obclient -h127.0.0.1 -P2881 -uroot@sys -p'T+%p=A;c8:AupMI' -Doceanbase -A
cluster unique id: b2c119ba-9aa0-5ab1-9712-2d932b6f2a99-199142cc4de-03050304
Stop obproxy-ce ok
start obproxy ok
obproxy program health check ok
Connect to obproxy ok
+------------------------------------------------------------------+
|                            obproxy-ce                            |
+--------------+------+-----------------+-----------------+--------+
| ip           | port | prometheus_port | rpc_listen_port | status |
+--------------+------+-----------------+-----------------+--------+
| 127.0.0.1 | 2883 | 2884            | 2885            | active |
+--------------+------+-----------------+-----------------+--------+
obclient -h127.0.0.1 -P2883 -uroot@proxysys -p'y6e)0l0)RnU=~eS' -Doceanbase -A
Stop obagent ok
Start obagent ok
obagent program health check ok
Connect to Obagent ok
+-----------------------------------------------------------------+
|                             obagent                             |
+--------------+--------------------+--------------------+--------+
| ip           | mgragent_http_port | monagent_http_port | status |
+--------------+--------------------+--------------------+--------+
| 127.0.0.1 | 8089               | 8088               | active |
+--------------+--------------------+--------------------+--------+
Stop prometheus ok
Start promethues ok
prometheus program health check ok
Connect to Prometheus ok
+-------------------------------------------------------------------+
|                             prometheus                            |
+--------------------------+-------+-----------------------+--------+
| url                      | user  | password              | status |
+--------------------------+-------+-----------------------+--------+
| http://127.0.0.1:9098 | admin | 'P&Gct0Z6j,?_OvFc%c[' | active |
+--------------------------+-------+-----------------------+--------+
Stop grafana ok
Start grafana ok
grafana program health check ok
Connect to grafana ok
+------------------------------------------------------------------------------------+
|                                      grafana                                       |
+--------------------------------------+-------+----------------------------+--------+
| url                                  | user  | password                   | status |
+--------------------------------------+-------+----------------------------+--------+
| http://127.0.0.1:3008/d/oceanbase | admin | 'Ar1=wj-?[NgX)kP.5XKjSHBE' | active |
+--------------------------------------+-------+----------------------------+--------+
ob_single_web restart
Trace ID: 547a2f30-8997-11f0-b8a9-0050568197df
If you want to view detailed obd logs, please run: obd display-trace 547a2f30-8997-11f0-b8a9-0050568197df
[root@worker3 obd350]#
5. 查看集群状态(
obd cluster display 集群名)
该命令比
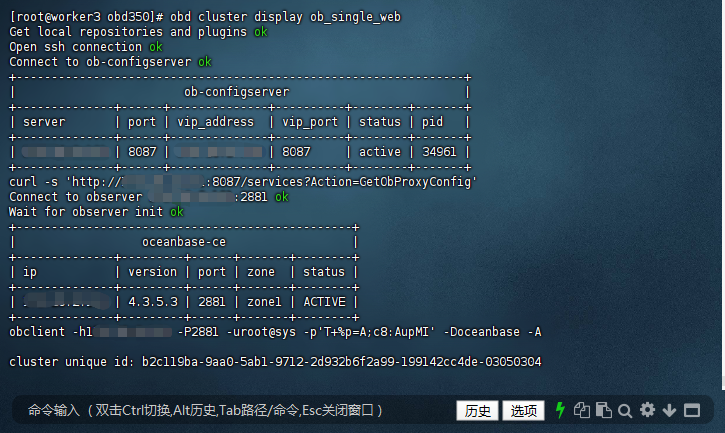
obd cluster status 更详细,会输出所有组件(ob-configserver、observer、obproxy、监控组件)的状态、端口、访问地址、密码等信息,是日常巡检的核心命令。示例中查看“ob_single_web”集群状态,所有组件均为“active”,可直接获取数据库连接命令与 Grafana 访问地址。
[root@worker3 obd350]# obd cluster display ob_single_web
Get local repositories and plugins ok
Open ssh connection ok
Connect to ob-configserver ok
+----------------------------------------------------------------+
|                        ob-configserver                         |
+--------------+------+--------------+----------+--------+-------+
| server       | port | vip_address  | vip_port | status | pid   |
+--------------+------+--------------+----------+--------+-------+
| 127.0.0.1 | 8087 | 127.0.0.1 | 8087     | active | 34961 |
+--------------+------+--------------+----------+--------+-------+
curl -s 'http://127.0.0.1:8087/services?Action=GetObProxyConfig'
Connect to observer 127.0.0.1:2881 ok
Wait for observer init ok
+------------------------------------------------+
|                  oceanbase-ce                  |
+--------------+---------+------+-------+--------+
| ip           | version | port | zone  | status |
+--------------+---------+------+-------+--------+
| 127.0.0.1 | 4.3.5.3 | 2881 | zone1 | ACTIVE |
+--------------+---------+------+-------+--------+
obclient -h127.0.0.1 -P2881 -uroot@sys -p'T+%p=A;c8:AupMI' -Doceanbase -A
cluster unique id: b2c119ba-9aa0-5ab1-9712-2d932b6f2a99-199142cc4de-03050304
Connect to obproxy ok
+------------------------------------------------------------------+
|                            obproxy-ce                            |
+--------------+------+-----------------+-----------------+--------+
| ip           | port | prometheus_port | rpc_listen_port | status |
+--------------+------+-----------------+-----------------+--------+
| 127.0.0.1 | 2883 | 2884            | 2885            | active |
+--------------+------+-----------------+-----------------+--------+
obclient -h127.0.0.1 -P2883 -uroot@proxysys -p'y6e)0l0)RnU=~eS' -Doceanbase -A
Connect to Obagent ok
+-----------------------------------------------------------------+
|                             obagent                             |
+--------------+--------------------+--------------------+--------+
| ip           | mgragent_http_port | monagent_http_port | status |
+--------------+--------------------+--------------------+--------+
| 127.0.0.1 | 8089               | 8088               | active |
+--------------+--------------------+--------------------+--------+
Connect to Prometheus ok
+-------------------------------------------------------------------+
|                             prometheus                            |
+--------------------------+-------+-----------------------+--------+
| url                      | user  | password              | status |
+--------------------------+-------+-----------------------+--------+
| http://127.0.0.1:9098 | admin | 'P&Gct0Z6j,?_OvFc%c[' | active |
+--------------------------+-------+-----------------------+--------+
Connect to grafana ok
+------------------------------------------------------------------------------------+
|                                      grafana                                       |
+--------------------------------------+-------+----------------------------+--------+
| url                                  | user  | password                   | status |
+--------------------------------------+-------+----------------------------+--------+
| http://127.0.0.1:3008/d/oceanbase | admin | 'Ar1=wj-?[NgX)kP.5XKjSHBE' | active |
+--------------------------------------+-------+----------------------------+--------+
obshell program health check ok
display ob-dashboard ok
+--------------------------------------------------------------+
|                         ob-dashboard                         |
+--------------------------+------+-------------------+--------+
| url                      | user | password          | status |
+--------------------------+------+-------------------+--------+
| http://127.0.0.1:2886 | root | 'T+%p=A;c8:AupMI' | active |
+--------------------------+------+-------------------+--------+
Trace ID: 2cc3a24a-8998-11f0-bb13-0050568197df
If you want to view detailed obd logs, please run: obd display-trace 2cc3a24a-8998-11f0-bb13-0050568197df
[root@worker3 obd350]#
6. 停止集群(补充示例)
[root@worker3 obd350]# obd cluster stop ob_single_web
Get local repositories ok
Get local repositories and plugins ok
Open ssh connection ok
Stop ob-configserver ok
Stop observer ok
Stop obshell ok
Stop obproxy-ce ok
Stop obagent ok
Stop prometheus ok
Stop grafana ok
ob_single_web stopped
Trace ID: 543c0244-8999-11f0-a4b0-0050568197df
If you want to view detailed obd logs, please run: obd display-trace 543c0244-8999-11f0-a4b0-0050568197df
[root@worker3 obd350]#
7. 销毁集群
命令:
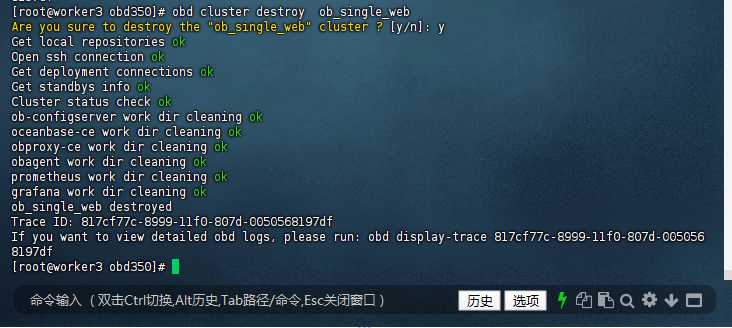
obd cluster destroy 集群名(示例:
obd cluster destroy ob_single_web)
[root@worker3 obd350]# obd cluster destroy  ob_single_web
Are you sure to destroy the "ob_single_web" cluster ? [y/n]: y
Get local repositories ok
Open ssh connection ok
Get deployment connections ok
Get standbys info ok
Cluster status check ok
ob-configserver work dir cleaning ok
oceanbase-ce work dir cleaning ok
obproxy-ce work dir cleaning ok
obagent work dir cleaning ok
prometheus work dir cleaning ok
grafana work dir cleaning ok
ob_single_web destroyed
Trace ID: 817cf77c-8999-11f0-807d-0050568197df
If you want to view detailed obd logs, please run: obd display-trace 817cf77c-8999-11f0-807d-0050568197df
[root@worker3 obd350]#
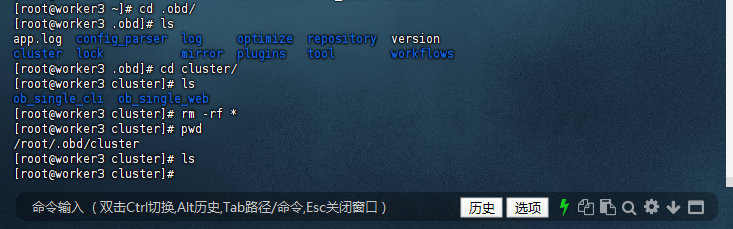
8. 清理目录(辅助操作)
root@worker3 ~]# cd .obd/
[root@worker3 .obd]# ls
app.log  config_parser  log     optimize  repository  version
cluster  lock           mirror  plugins   tool        workflows
[root@worker3 .obd]# cd cluster/
[root@worker3 cluster]# ls
ob_single_cli  ob_single_web
[root@worker3 cluster]# rm -rf *
[root@worker3 cluster]# pwd
/root/.obd/cluster
[root@worker3 cluster]# ls
[root@worker3 cluster]#
9. 查看部署日志与检查集群健康度
- 查看日志:
obd cluster log 集群名(示例:obd cluster log ob_single_web) - 检查健康度:
obd cluster check 集群名(示例:obd cluster check ob_single_web)
三、部署常见问题与解决方案
| 问题现象 | 原因分析 | 解决方案 |
|---|---|---|
| 白屏界面无法访问 | 端口被占用 / 防火墙未关闭 | 换端口启动
obd web start --port 8082;关闭防火墙 |
| 部署时提示“权限不足” | 数据路径无写入权限 | 执行
chmod -R 777 /data/ob 授权(测试环境) |
| 集群启动后状态为“abnormal” | 内存不足 / 配置错误 | 调小内存参数:
obd cluster edit-config 集群名 修改配置后重启 |
| 连接数据库提示“拒绝连接” | 服务未启动 / 端口错误 | 启动集群
obd cluster start 集群名;检查端口是否为 2881 |
四、总结
OBD 3.5.0 的白屏部署与交互式部署各有优势:
- 白屏部署:可视化操作,零命令门槛,适合新手快速搭建测试环境;
- 交互式部署:命令行向导引导,参数配置更灵活,适合熟悉终端的用户。
通过本文的步骤实操,相信读者已能熟练掌握两种部署方式。结合 OBD 丰富的管理命令,不仅能高效完成部署,还能轻松应对集群启停、状态检查等日常运维工作。
建议新手从白屏部署入手,熟悉后尝试交互式部署,逐步掌握配置文件批量部署(进阶技能),全方位提升 OceanBase 运维效率。未来,期待 OBD 持续优化界面交互与报错提示,让数据库部署更简单、更智能!
通过以上步骤,即可完成 OBD 交互式部署 OceanBase 单机版的部署与基本管理。如需更多功能请参考官方文档。
作者注:
——本文所有操作及测试均基于 OceanBase 的 OBD 3.5.0 版本完成。请注意,OceanBase 和 OBD 3.5.0 版本处于持续迭代中,部分语法或功能可能随更新发生变化,请以 OceanBase 官方文档 最新内容为准。
——以上仅为个人思考与建议,不代表行业普适观点。以上所有操作均需在具备足够权限的环境下执行,涉及生产环境时请提前做好备份与测试。文中案例与思路仅供参考,若与实际情况巧合,纯属无意。期待与各位从业者共同探讨更多可能!
来自 “ ITPUB博客 ” ,链接:https://blog.itpub.net/70042915/viewspace-3095393/ ,如需转载,请注明出处,否则将追究法律责任。

