 免费9篇/更新中
 免费15篇/已完结
-
编辑 删除
Cursor Cache Hit Ratio超过100%
这种Ratio超过100的是正常的吗?目前我们的监控对这种超过的处理有点问题11g到19c各个版本都有这个情况。 这是正常现象, Cursor Cache Hit Ratio指标的来源是:session cursor cache hits / (parse count (total) - parse count (hard))。其中session cursor ca
-
编辑 删除
sqlplus as sysdb登录报ora-01017
1.报错信息:cnsh281177:t3fxqdb > sqlplus '/as sysdba' SQL*Plus: Release 12.1.0.2.0 Production on Wed Apr 14 09:28:15 2021 Copyright (c) 1982, 2014, Oracle. All rights reserved.&n
-
编辑 删除
SQL的reload以及Invalidations
关于SQL的游标版本不高,但reload以及Invalidations次数相对比较多。基本上是每一次Invalidations便伴随着一次reload. 关于load以及Invalidations的说明如下, Invalidations - An invalidation is a measure of the number of times a cached cursor
-
编辑 删除
关于obsolete child cursor问题
查MOS发现如下bug:Bug 22994542 Child cursor counts increase with TYPECHECK_MISMATCH with Unified Auditing 里面给出了一个workaround 是调整隐藏参数 _cursor_obsolete_threshold。 _cursor_obsolete_threshol
-
编辑 删除
转载ORA-01591错误故障处理(ji)
ORA-01591错误故障处理摘要:在访问某些表的特定行时报ORA-01591错误select * from BF_INCOME_EXPENSES_Twhere account_id = 36816153and user_id = 39964213and city_code = '185'ORA-01591: 锁定已被有问题的分配事务处理72.0.1608712挂起SQL
-
编辑 删除
ORA-29702: error occurred in Cluster Group Service operation
ORA-29702: error occurred in Cluster Group Service operationIf you are working on Solaris and having Oracle database 10g or above, you might face ORA-29702 issue after reboot of your server
-
编辑 删除
Innodb内存管理解析[转载]
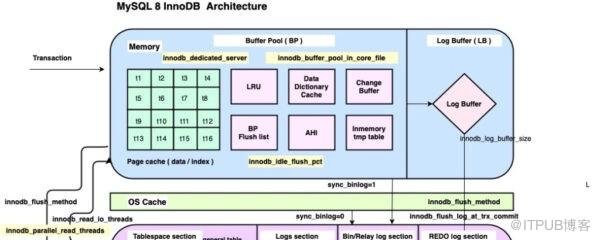
本文转自http://mysql.taobao.org/monthly/2021/01/06/本文主要介绍innodb的内存管理,涉及基础的内存分配结构、算法以及buffer pool的实现细节,提及change buffer、自适应hash index和log buffer的基本概念和内存基本配比,侧重点在内存的分配和管理方式。本文所述内容基于mysql8.0版本。基础内存分配在5.6以前的版本
-
编辑 删除
Bug 31625618 DML Over a LOB Column ORA-3137 [3146]When the Bind Size is > 256k
19c的bug, Bug 31625618 DML Over a LOB Column Using Long Bind Fails with ORA-3137 [3146] [4] / ORA-3137 [3146] [94] When the Bind Size is > 256k Bytes 这个bug补丁是前段时间刚出来,影响版
-
编辑 删除
ORACLE通过透明网关建dblink连接Postgresql的几个问题
问题1:where条件查询失败ORA-00997:select "big","small" from "test_bigint"@dblink_b_bak where "big"='1';select "big","small" from "test_b
-
编辑 删除
MySQL数据库架构——高可用演进
原创 徐轶韬 MySQL解决方案工程师 MySQL发展至今,在高可用性方面
-
编辑 删除
MySQL数据库SYS CPU高的可能性分析
转自:http://mysql.taobao.org/monthly/2015/05/02/问题背景我们在管理繁忙的 MySQL 数据库时,可能都有碰到 SYS CPU 高的经历:系统突然 SYS CPU 高起来,甚至比 USER CPU 高很多,这时系统 QPS、TPS 急剧下降。SYS CPU高是什么造成的呢?主要有2种可能:context switch 不高,但在内核态 spin,导致 SY
-
编辑 删除
MYSQL connector 的 NullReferenceException bug
mysql connector 连接报错, 客户端在MySqlClient.MySqlDataReader.NextResult() 处报错,IIS进程池crash后 db端提示Got an error reading communication packets。异常时堆栈调用信息:ServerConnectionInfo.Finallize()=>ServerConnection
-
编辑 删除
MYSQL connector/.NET 默认的 show variables 引起的线程mutex锁争用
1)检查当时的主机资源状态,其cpu 内存,磁盘IO 负载实际都并不高。 复查主机资源发现当时的load avage指标异常,1分钟平均负载量达到100以上,5分钟平均负载量达到90以上,10分钟平均负载量达到60以上,说明当时cpu的运行队列出现排队现象。2)当时的thread cache size 分别出现两次耗尽情况,大量的线程处于running的状态。3)从后台慢日志看,show vari
-
编辑 删除
obj$等数据字典表的统计信息采集机制一些整理
从11g开始,自动统计信息收集任务的时间窗口:11g+ Automatic Maintenance TasksWhat is the name of the default stats gathering job on 11g?The automatic statistics gathering job on 11g is called "auto optimizer stats col
-
编辑 删除
关于Heap中的一些概念
Oracle的内存是以heap的形式进行管理,这包括常见的SGA和PGA。- 物理形式上,一个内存heap包括header或者header descriptor以及一些extents 。- 逻辑形式上,一个heap可能包含多个subheap。subheap中的extents来源于它的父heap;heap和subheap通过free lists和LRU lists来管理空闲以及使用的空间
-
编辑 删除
关于mysql字符集及排序规则设置
How Can I Change the Default Character Set and Collation for a Database in MySQL? (Doc ID 1023320.1)To determine the default character set and collation for a database, enter this SQL statement:查询:Beg
-
编辑 删除
datapump 导出导入ORA-07445
没有规范整理,比较乱,仅作为笔记备忘!Archived Log entry 52860 added for thread 1 sequence 52864 ID 0x453c1294 dest 1:Wed Aug 12 19:27:25 2020DM00 started with pid=628, OS id=46554, job SYS.SYS_EXPORT_SCHEMA_01Wed Aug 1
-
编辑 删除
create index ORA-00376 处理方法
临时段reuse引起的异常,小记!SQL> create index cwdtest.testidx1 on cwdtest.tab_level_2(FID) tablespace testidx;create index cwdtest.testidx1 on cwdtest.tab_level_2(FID) tablespace testidx &nbs
-
编辑 删除
java.sql.SQLRecoverableException: IO Error: Socket read timed out 排查历程
一:12c迁移19c工程,针对大数据相关定时作业进行性能对比,发现部分作业连接19c 出现 Socket read timed out 问题,并且可以复现,该部分作业连接12c并无异常初步排查情况如下:1)在执行到某部分sql时jdbc抛出Error: java.io.IOException: SQLException in nextKeyValue 错误,导致的原因是Caused by: jav
-
编辑 删除
oracle 并行查询时并行资源分配追踪测试
小实验:通过oracle自带的并行追踪进行对比测试,参考文档(Tracing Parallel Execution with _px_trace (Doc ID 444164.1))。分别进行了3次对比测试:1.第一次实验:parallel_max_servers=2,表并行度=2,查询观察启用并行进程情况。 实验结果:执行计划px,sql启用2个并行
