Cursor Cache Hit Ratio超过100%
这种Ratio超过100的是正常的吗?
目前我们的监控对这种超过的处理有点问题
11g到19c各个版本都有这个情况。
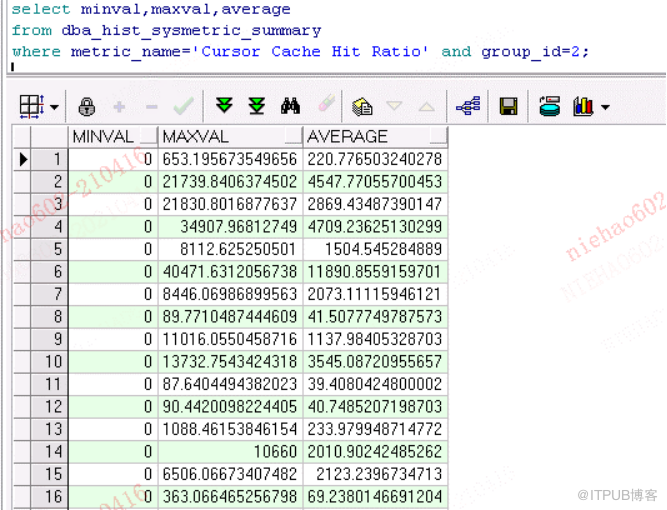
这是正常现象, Cursor Cache Hit Ratio 指标的来源是: session cursor cache hits / (parse count (total) - parse count (hard)) 。其中 session cursor cache hits 是指在 在 session cursor cache 中找到 cursor 的次数,这个可能会比较大。例如我们循环查询某条 sql ,每一次从 session cursor cache 找到一次便是增加一次,而解析次数是不用再增加的。因此得到的 session cursor cache hits / (parse count (total) - parse count (hard)) 值是可能超过 100% 的。
|
SQL> select m.*, n.NAME 2 from v$mystat m, v$statname n 3 where m.STATISTIC# = n.STATISTIC# 4 and (n.name in ('session cursor cache hits','session cursor cache count','parse count (total)')) ;
SID STATISTIC# VALUE CON_ID NAME ---------- ---------- ---------- ---------- ------------------------------ 1 643 0 0 session cursor cache hits 1 644 1 0 session cursor cache count 1 694 3 0 parse count (total)
declare c number ; begin for i in 1 .. 10000 loop execute immediate 'select count(*) from dba_objects' into c ; end loop ; end ; /
PL/SQL procedure successfully completed.
select m.*, n.NAME from v$mystat m, v$statname n where m.STATISTIC# = n.STATISTIC# and (n.name in ('session cursor cache hits','session cursor cache count','parse count (total)')) ;
SID STATISTIC# VALUE CON_ID NAME ---------- ---------- ---------- ---------- ------------------------------ 1 643 10000 0 session cursor cache hits 1 644 3 0 session cursor cache count 1 694 7 0 parse coun |
当前这个数据库中的总体命中率也是达到 314.79% 的。(这个指标是指实例启动以来的总体指标统计,与 sysmetric 不同的是, sysmetric 是每一个间隔时间内的统计)
|
select a.value cache_hits, b.value total_parses, c.value hard_parses, (b.value - c.value) soft_parses, round((a.value / (b.value - c.value))*100,2)||'%' ratio from v$sysstat a, v$sysstat b, v$sysstat c where a.name = 'session cursor cache hits' and b.name = 'parse count (total)' and c.name = 'parse count (hard)';
CACHE_HITS TOTAL_PARSES HARD_PARSES SOFT_PARSES RATIO ---------- ------------ ----------- ----------- ----------------------------------------- 4333516791 1444991516 68350276 1376641240 314.79%
|
参考:
'SESSION CURSOR CACHE HITS' IS LARGER THAN 'PARSE COUNT'
(Bug ID 6200422)
文档中开发已说明这是正常行为。
** NLEE 07/09/08 04:00 pm ***
@ I see the same behavior in 11.2.0 (label 'RDBMS_MAIN_LINUX_080708')
@ and am currently investigating.
*** NLEE 07/15/08 07:21 pm *** (CHG: Sta->32)
*** NLEE 07/15/08 07:21 pm ***
@
I spoke with base development and they confirmed that this
@ is the expected behavior.
This is because the cache hit count
@ now includes kqd cursors but the parse count does not include
@ them. The documentation will need to be updated. Please
@ open a 'doc' bug for this.
@ .
@ Since this is the expected behavior, I am now closing this
@ bug with status 32.
来自 “ ITPUB博客 ” ,链接:https://blog.itpub.net/29863023/viewspace-2783934/ ,如需转载,请注明出处,否则将追究法律责任。

