一、监控对象
Prometheus监控范围覆盖IT基础设施层通用的服务器、中间件、数据库、容器/集群、服务可用性的指标,根据实际生产业务场景需要选择IaaS层、PaaS层、SaaS层监控指标包含但不限于以下内容。
|
监控对象 |
类型 |
监控内容 |
采集频率 |
|
IaaS层 |
物理机 |
服务器状态
网络流量/重传/丢包/拥塞
|
秒级/分钟级 |
|
虚拟机 |
秒级/分钟级 | ||
|
PaaS层 |
数据库 |
集群状态 连接数(活跃/最大/当前/) 数据实例/对象/表空间/慢查询 Buffer/死锁
负载 |
分钟级 |
|
中间件 |
状态 连接/请求数 会话数 |
分钟级 | |
|
容器 |
运行时间 集群状态/网络流量
Container数量/状态/利用率 资源对象使用情况 |
秒级 | |
|
SaaS层 |
应用服务 |
服务可用性(http/https/tcp探测) 会话数/连接数/请求数
|
秒级/分钟级 |
1、采集探针
常见采集探针部署实例:
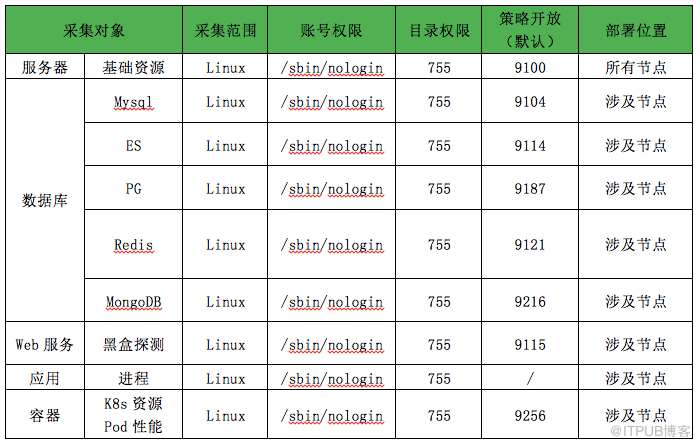
2、采集指标
基础资源指标示例: curl localhost:9100/metrcis
# TYPE node_cpu_seconds_total counternode_cpu_seconds_total{cpu="0",mode="idle"} 5.76669737e+06node_cpu_seconds_total{cpu="0",mode="iowait"} 4.48node_cpu_seconds_total{cpu="0",mode="irq"} 0node_cpu_seconds_total{cpu="0",mode="nice"} 1055.58node_cpu_seconds_total{cpu="0",mode="softirq"} 2413.11# TYPE node_disk_info gaugenode_disk_info{device="dm-0",major="252",minor="0"} 1node_disk_info{device="nbd0",major="43",minor="0"} 1node_disk_info{device="nbd1",major="43",minor="32"} 1node_disk_info{device="nbd10",major="43",minor="320"} 1node_disk_info{device="nbd11",major="43",minor="352"} 1node_disk_info{device="nbd12",major="43",minor="384"} 1node_disk_info{device="nbd13",major="43",minor="416"} 1
MySQL 数据库指标实例:curl localhost:9104/metrics
# TYPE mysql_global_variables_sync_master_info gaugemysql_global_variables_sync_master_info 10000# TYPE mysql_global_variables_sync_relay_log gaugemysql_global_variables_sync_relay_log 10000# TYPE mysql_global_variables_sync_relay_log_info gaugemysql_global_variables_sync_relay_log_info 10000# TYPE mysql_global_variables_table_definition_cache gaugemysql_global_variables_table_definition_cache 1400# TYPE mysql_global_variables_table_open_cache gaugemysql_global_variables_table_open_cache 2000# TYPE mysql_global_variables_table_open_cache_instances gaugemysql_global_variables_table_open_cache_instances 16# TYPE mysql_global_variables_thread_cache_size gaugemysql_global_variables_thread_cache_size 9# TYPE mysql_global_variables_thread_stack gaugemysql_global_variables_thread_stack 262144# TYPE mysql_global_variables_tmp_table_size gaugemysql_global_variables_tmp_table_size 1.6777216e+07# TYPE mysql_global_variables_transaction_alloc_block_size gaugemysql_global_variables_transaction_alloc_block_size 8192
3、Prometheus Server 服务端配置
1)服务器监控
- job_name: 'node' metric_path:/metrics scheme: http scrape_interval: 30s scrape_timeout: 20s file_sd_configs: - files: ['/prom/targets/node.yml'] refresh_interval: 30s
配置说明:其中
Job_name代表一系列采集 target 集合,scrape_timeout表示抓取超时判断,它的设定应小于scrape_interval,否则会报逻辑错误。抓取对象采用基于文件的服务发现机制file_sd_configs,其中files表示文件内容如下,refresh_interval表示刷新频率。
- labels: system: 演示平台 serverType: 虚拟机 targets: - 192.168.0.1:9100 - 192.168.0.2:9100 - 192.168.0.3:9100 - 192.168.0.4:9100
说明:labels 字段用键值对形式标识时序数据,便于后续检索使用,targets 字段是实际监控对象集合,暴露端口默认为9100,可根据情况在采集侧指定为任何合法端口。
二、监控可视化
1、数据源
对接 prometheus 数据源
2、资源概览图

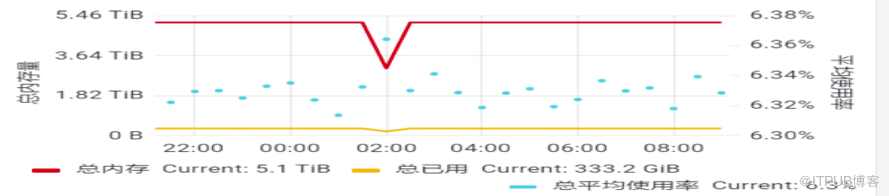
K8s 的 pod 资源概览信息
基于命名空间的资源对象统计信息

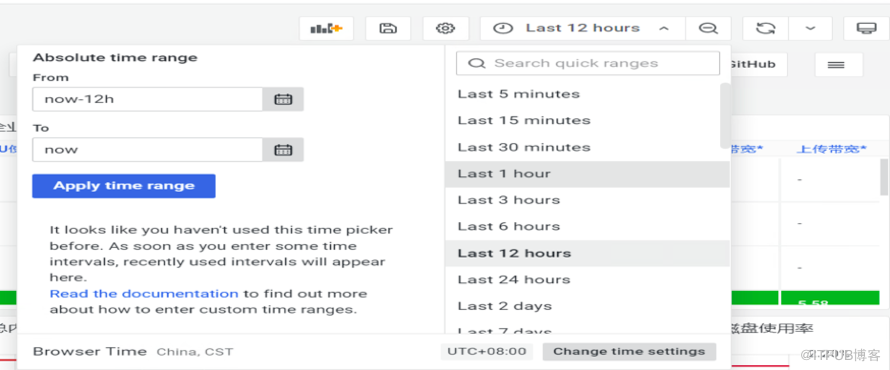
支持基于时间范围的检索
3、用户权限管理

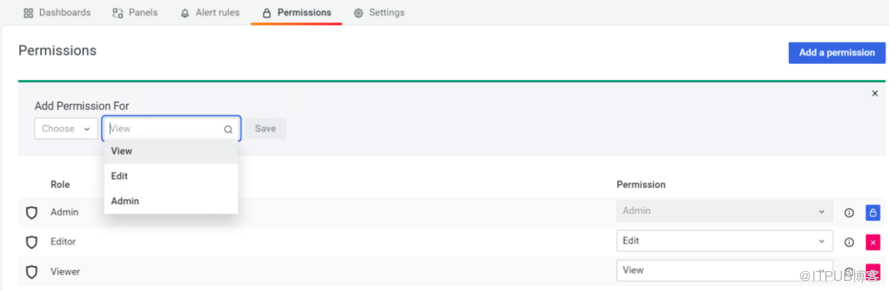
Grafana用户权限部分有 user,team,role,org的概念,
-
org 对应类似租户的概念,可以对接不同数据源,是一个比较大的概念。 -
role 根据需要分为admin,editor,viewer 三种不同操作权限。 -
team 是用户组的概念,一组相同权限用户组成的概念组。 -
user 是基本用户概念,与team、role、org 关联
三、告警管理
1、告警规则
示例:内存使用率过高
======================================================- alert: 内存使用过高expr: 100 -(node_memory_MemAvailable_bytes{project= 'xx'} / node_memory_MemTotal_bytes{project= 'xx'}) * 100 > 98for: 5mlabels:severity: 紧急type: 服务器annotations:summary: '{{$labels.mountpoint}} 内存使用率过高!'description: '{{$labels.mountpoint }} 内存使用大于98%(目前使用:{{ printf "%.2f" $value }}%)'- alert: 磁盘使用过高expr: 100-(node_filesystem_free_bytes{fstype=~ 'ext4|xfs'}/node_filesystem_size_bytes {fstype=~ 'ext4|xfs'}*100) > 92for: 5mlabels:severity: 严重type: 服务器annotations:summary: '{{$labels.mountpoint}} 磁盘分区使用率过高!'description: '{{$labels.mountpoint }} 磁盘分区使用大于92%(目前使用:{{ printf "%.2f" $value }}%)'=========================================================
-
alert 为告警名称 -
expr 为告警表达式,就是具体的规则定义 -
for 为告警等待时长,多久判定为告警 -
lables 是自定义告警标签,如本例中告警级别和告警类型,可以通过路由机制,过滤不同标签发送指定组接收 -
annotations 告警描述,发送告警的具体信息
2、告警状态
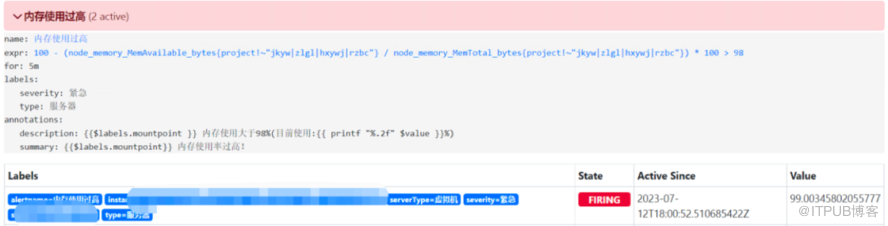
Prometheus 告警状态有三种状态:Inactive、Pending、Firing。
-
Inactive :非活动状态,表示正在监控,但是还未有任何警报触发。 -
Pending :表示这个警报必须被触发。由于警报可以被分组、压抑/抑制或静默/静音,所以等待验证,一旦所有的验证都通过,则将转到 Firing 状态。 -
Firing :将警报发送到 AlertManager,它将按照配置将警报的发送给所有接收者。一旦警报解除,则将状态转到 Inactive,如此循环。
3、告警发送
告警信息示例如下:
==========异常告警==========[告警系统]:**运维系统[告警对象]:服务器[告警级别]:一般[告警时间]:2023-07-13 08:58:52[告警实例]:127.0.0.1:9100[告警内容]:内存使用大于85%(目前使用:85.42%)[来自***运维系统准生产测试]
来自 “ ITPUB博客 ” ,链接:https://blog.itpub.net/70013542/viewspace-2968706/ ,如需转载,请注明出处,否则将追究法律责任。

