2、排查思路
2.1 定位高负载进程 pid

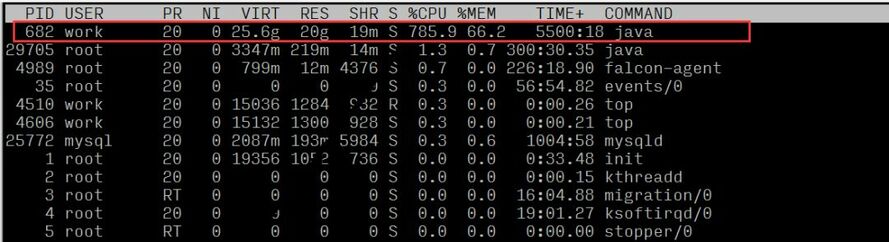
观察各个进程资源使用情况,可以看出进程id为682的进程,有着较高的CPU占比
2.2 定位具体的异常业务

可得出结论:该进程对应的就是数据平台的web服务。
2.3 定位异常线程及具体代码行
传统的方案一般是4步:
1、top oder by with P:1040 // 首先按进程负载排序找到 maxLoad(pid)
2、top -Hp 进程PID:1073 // 找到相关负载 线程PID
3、printf “0x%x ”线程PID:0x431 // 将线程PID转换为 16进制,为后面查找 jstack 日志做准备
4、jstack 进程PID | vim +/十六进制线程PID - // 例如:jstack 1040|vim +/0x431 -
但是对于线上问题定位来说,分秒必争,上面的 4 步还是太繁琐耗时了,之前介绍过淘宝的 oldratlee 同学就将上面的流程封装为了一个工具:show-busy-java-threads.sh,可以很方便的定位线上的这类问题:
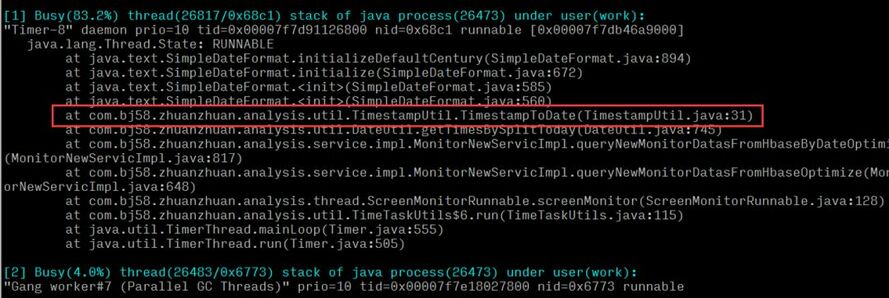
可得出结论:是系统中一个时间工具类方法的执行cpu占比较高,定位到具体方法后,查看代码逻辑是否存在性能问题。
※ 如果线上问题比较紧急,可以省略 2.1、2.2 直接执行 2.3,这里从多角度剖析只是为了给大家呈现一个完整的分析思路。
3、 根因分析
-
异常方法逻辑: 是把时间戳转成对应的具体的日期时间格式; -
上层调用: 计算当天凌晨至当前时间所有秒数,转化成对应的格式放入到set中返回结果; -
逻辑层: 对应的是数据平台实时报表的查询逻辑,实时报表会按照固定的时间间隔来,并且在一次查询中有多次(n次)方法调用。
4、解决方案

5、总结
-
在编码的过程中,除了要实现业务的逻辑,也要注重代码性能的优化。 一个业务需求,能实现,和能实现的更高效、更优雅其实是两种截然不同的工程师能力和境界的体现,而后者也是工程师的核心竞争力。 -
在代码编写完成之后,多做 review,多思考是不是可以用更好的方式来实现。 -
线上问题不放过任何一个小细节! 细节是魔鬼,技术的同学需要有刨根问题的求知欲和追求卓越的精神,只有这样,才能不断的成长和提升。
附上show-busy-java-threads.sh脚本:
#!/bin/bash# @Function# Find out the highest cpu consumed threads of java, and print the stack of these threads.## @Usage# $ ./show-busy-java-threads.sh## @author Jerry Leereadonly PROG=`basename$0`readonly-a COMMAND_LINE=("$0""$@")usage(){cat<<EOFUsage: ${PROG}[OPTION]...Find out the highest cpu consumed threads of java, and print the stack of these threads.Example: ${PROG}-c 10Options:-p,--pid find out the highest cpu consumed threads from the specifed java process,default from all java process.-c,--count set the thread count to show, default is 5-h,--help display this help and exitEOFexit$1}readonly ARGS=`getopt -n "$PROG" -a -o c:p:h -l count:,pid:,help -- "$@"`[ $?-ne 0]&& usage 1evalset--"${ARGS}"whiletrue;docase"$1"in-c|--count)count="$2"shift2;;-p|--pid)pid="$2"shift2;;-h|--help)usage;;--)shiftbreak;;esacdonecount=${count:-5}redEcho(){[-c /dev/stdout ]&&{# if stdout is console, turn on color output.echo-ne "\033[1;31m"echo-n "$@"echo-e "\033[0m"}||echo"$@"}yellowEcho(){[-c /dev/stdout ]&&{# if stdout is console, turn on color output.echo-ne "\033[1;33m"echo-n "$@"echo-e "\033[0m"}||echo"$@"}blueEcho(){[-c /dev/stdout ]&&{# if stdout is console, turn on color output.echo-ne "\033[1;36m"echo-n "$@"echo-e "\033[0m"}||echo"$@"}# Check the existence of jstack command!if!which jstack &>/dev/null;then[-z "$JAVA_HOME"]&&{redEcho "Error: jstack not found on PATH!"exit1}![-f "$JAVA_HOME/bin/jstack"]&&{redEcho "Error: jstack not found on PATH and $JAVA_HOME/bin/jstack file does NOT exists!"exit1}![-x "$JAVA_HOME/bin/jstack"]&&{redEcho "Error: jstack not found on PATH and $JAVA_HOME/bin/jstack is NOT executalbe!"exit1}export PATH="$JAVA_HOME/bin:$PATH"fireadonly uuid=`date +%s`_${RANDOM}_$$cleanupWhenExit(){rm/tmp/${uuid}_*&>/dev/null}trap"cleanupWhenExit" EXITprintStackOfThreads(){local linelocal count=1while IFS=" "read-a line ;dolocal pid=${line[0]}local threadId=${line[1]}local threadId0x="0x`printf %x ${threadId}`"local user=${line[2]}local pcpu=${line[4]}local jstackFile=/tmp/${uuid}_${pid}[!-f "${jstackFile}"]&&{{if["${user}"=="${USER}"];thenjstack ${pid}>${jstackFile}elseif[$UID==0];thensudo -u ${user} jstack ${pid}>${jstackFile}elseredEcho "[$((count++))] Fail to jstack Busy(${pcpu}%) thread(${threadId}/${threadId0x}) stack of java process(${pid}) under user(${user})."redEcho "User of java process($user) is not current user($USER), need sudo to run again:"yellowEcho " sudo ${COMMAND_LINE[@]}"echocontinuefifi}||{redEcho "[$((count++))] Fail to jstack Busy(${pcpu}%) thread(${threadId}/${threadId0x}) stack of java process(${pid}) under user(${user})."echorm${jstackFile}continue}}blueEcho "[$((count++))] Busy(${pcpu}%) thread(${threadId}/${threadId0x}) stack of java process(${pid}) under user(${user}):"sed "/nid=${threadId0x} /,/^$/p"-n ${jstackFile}done}ps -Leo pid,lwp,user,comm,pcpu --no-headers |{[-z "${pid}"]&&awk '$4=="java"{print $0}'||awk -v "pid=${pid}"'$1==pid,$4=="java"{print $0}'}|sort-k5 -r -n |head--lines "${count}"| printStackOfThreads
来源:网络
来自 “ ITPUB博客 ” ,链接:https://blog.itpub.net/70013542/viewspace-3021741/ ,如需转载,请注明出处,否则将追究法律责任。

