ORA-07445: [kkorminl()+306] 故障处理
1 数据库告警
Sun Feb 07 10:03:50 2021
Exception [type: SIGSEGV, Address not mapped to object] [ADDR:0x7FFEF8708FF8] [PC:0x958E280, kkorminl()+306] [flags: 0x0, count: 1]
Errors in file /u01/app/oracle/diag/rdbms/test/test2/trace/test2_j000_94047.trc (incident=301804):
ORA-07445: exception encountered: core dump [kkorminl()+306] [SIGSEGV] [ADDR:0x7FFEF8708FF8] [PC:0x958E280] [Address not mapped to object] []
Incident details in: /u01/app/oracle/diag/rdbms/test/test2/incident/incdir_301804/test2_j000_94047_i301804.trc
Use ADRCI or Support Workbench to package the incident.
2 查看trace文件 发现应该是ORA$AT_SQ_SQL_SW_37704 SQL调试引起的
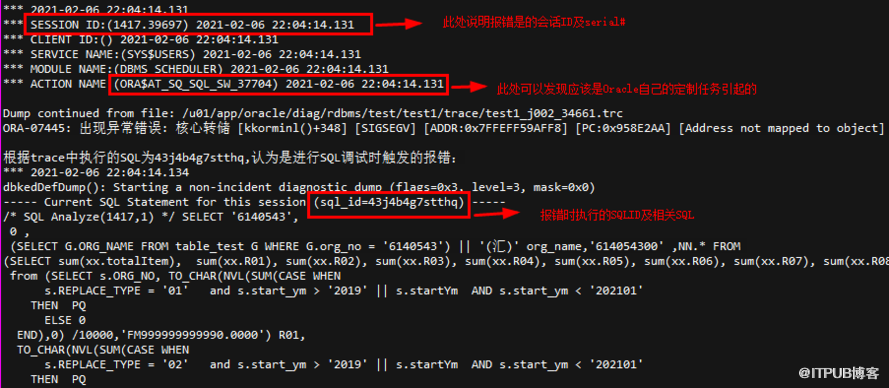
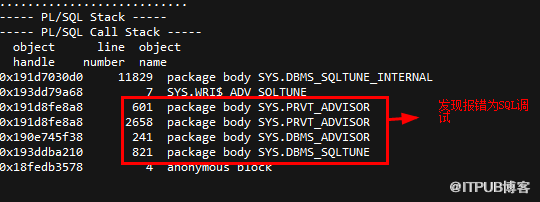
3 根据trace文件中的sid和serial#,查看此会话执行的SQL,发现同trace中报错的SQL是一致的
SQL> select INSTANCE_NUMBER,to_char(SAMPLE_TIME,'yyyy-mm-dd HH24:mi:ss'),SESSION_ID,SESSION_SERIAL#,SQL_ID from dba_hist_active_sess_history where
2 SESSION_ID=1417 and SESSION_SERIAL#=39697;
I TO_CHAR(SAMPLE_TIME SESSION_ID SESSION_SERIAL# SQL_ID
--- ------------------- ---------- --------------- ------------------
1 2021-02-06 22:03:40 1417 39697 424h0nf7bhqzd
1 2021-02-06 22:03:50 1417 39697 a4spu779ntqpd
1 2021-02-06 22:04:00 1417 39697 fh6jwhykj1v30
1 2021-02-06 22:04:10 1417 39697 43j4b4g7stthq
1 2021-02-06 22:04:20 1417 39697 43j4b4g7stthq
4 根据报错的信息,对相关SQL再次进行调试测试,看是否可以再次触发ORA-07445,发现进行调试,再次触发了ORA-07445错误
SQL> @?/rdbms/admin/sqltrpt.sql
15 Most expensive SQL in the cursor cache
~~~~~~~~~~~~~~~~~~~~~~~~~~~~~~~~~~~~~~~~~
.................................
Specify the Sql id
~~~~~~~~~~~~~~~~~~
Enter value for sqlid: 43j4b4g7stthq
Sql Id specified: 43j4b4g7stthq
Tune the sql
~~~~~~~~~~~~
ERROR:
ORA-03114: not connected to ORACLE
DECLARE
*
ERROR at line 1:
ORA-03113: end-of-file on communication channel
Process ID: 84320
Session ID: 1537 Serial number: 30531
ERROR:
ORA-03114: not connected to ORACLE
5 在执行此SQL的调试时,触发了ORA-07445错误
Mon Feb 08 18:17:23 2021
Exception [type: SIGSEGV, Address not mapped to object] [ADDR:0x7FFBFF42AFE8] [PC:0x958E280, kkorminl()+306] [flags: 0x0, count: 1]
Errors in file /u01/app/oracle/diag/rdbms/test/test1/trace/test1_ora_84320.trc (incident=302098):
ORA-07445: exception encountered: core dump [kkorminl()+306] [SIGSEGV] [ADDR:0x7FFBFF42AFE8] [PC:0x958E280] [Address not mapped to object] []
Incident details in: /u01/app/oracle/diag/rdbms/test/test1/incident/incdir_302098/test1_ora_84320_i302098.trc
Use ADRCI or Support Workbench to package the incident.
See Note 411.1 at My Oracle Support for error and packaging details.
6 查看数据库的定制JOB,发现SQL调试是开启的
SQL> select client_name,status from dba_autotask_client where client_name='sql tuning advisor' and status='ENABLED';
CLIENT_NAME STATUS
---------------------------------------------------------------- --------
sql tuning advisor ENABLED
7 根据ORA-07445 Core dump file generation and ORA-07445 [kkorminl()] error (Doc ID 2198790.1)文档,此BUG的修复需要禁用sql tuning advisor
Core dump file generation and ORA-07445 [kkorminl()] error (Doc ID 2198790.1)
In this Document
Symptoms
Cause
Solution
References
APPLIES TO:
Oracle Database - Enterprise Edition - Version 11.2.0.4 and later
Oracle Database Cloud Schema Service - Version N/A and later
Oracle Database Exadata Cloud Machine - Version N/A and later
Oracle Cloud Infrastructure - Database Service - Version N/A and later
Oracle Database Backup Service - Version N/A and later
Information in this document applies to any platform.
SYMPTOMS
1. ORA-07445 error reported in the alert log:
ORA-07445: exception encountered: core dump [kkorminl()]
2. Incident trace reports the error plus details indicating execution of SQL Tuning Advisor:
ORA-07445: exception encountered: core dump [kkorminl()] [SIGSEGV] [ADDR:0xFFFFFFFF7DFFE000] [PC:0x102EA4860] [Stack Overflow] []
...
----- Current SQL Statement for this session (sql_id=9v57mb092px43) -----
/* SQL Analyze(320,1) */
SELECT .......
----- PL/SQL Call Stack -----
object line object
handle number name
4fb303040 0 package body SYS.DBMS_SQLTUNE_INTERNAL
4fb225fa0 0 SYS.WRI$_ADV_SQLTUNE
4fb5e12c8 0 package body SYS.PRVT_ADVISOR
4fb5e12c8 0 package body SYS.PRVT_ADVISOR
4fb30c598 0 package body SYS.DBMS_ADVISOR
4fb80aba0 0 package body SYS.DBMS_SQLTUNE
4fb267828 4 anonymous block
3. Call Stack similar to:
kkorminl <- kkorminl <- kkorminl
<- kkorminl <- kkorminl <- kkoConvertFilterInLists <- kkoipt
<- kkoqbc <- apakkoqb <- apaqbdDescendents <- apadrv
CAUSE
This has been investigated in the below bug
Bug 18451758 : ORA-07445 [KKORMINL+306] SOON AFTER JOB SYS_AUTO_SQL_TUNING_TASK RUNS ==== closed as duplicate
Bug 17339455 ORA-7445 [kkorminl] or similar can occur when running Automatic tuning tasks / DBMS_SQLTUNE Index Advisor
- this is a code defect
SOLUTION
1. Install patch 17339455
OR
2. WORKAROUND
If the issue occurs during automatic tuning then an option to avoid the dumps is to
disable the automatic tuning job.
eg:
BEGIN
dbms_auto_task_admin.disable(
client_name => 'sql tuning advisor',
operation => NULL,
window_name => NULL);
END;
/
OR
3. Upgrade to a fixed release:
- 12.1.0.2
- 12.2 (Future Release)
8 使用文档的方法,禁用SQl的自动调试
来自 “ ITPUB博客 ” ,链接:https://blog.itpub.net/69996316/viewspace-2777069/ ,如需转载,请注明出处,否则将追究法律责任。

最新文章
- ogg复制进程报ORA-01438错误处理
- logminer进行数据挖掘分析测试
- 大事务导致的OGG抽取进程每天7:39定时延时,运行极其缓慢
- EXPDP导出报ORA-31693 ORA-29913 ORA-01861错误
- goldengate的sqlexec测试
- AWR占用sysaux表空间太大
- DataPump Export ORA-31626 ORA-31633 ORA-00955
- ERROR: failed to update diskgroup resource ora.OCR_NEW.dg
- 高水位线导致OGG延迟过长
- expdp导出报ORA-31693、ORA-02354、ORA-01466
