背景:
今天开发反馈到我这,业务日志打出,有条sql在早上7点的时候,有两次执行特别慢,希望我这协助排查下。
查看awr报告

等待事件为
|
db file sequential read |
|
|
|
|
|
|
log file sync |
|
|
|
|
|
|
read by other session |
|
|
|
|
|
继续查看awr报告,发现热点都在索引上。
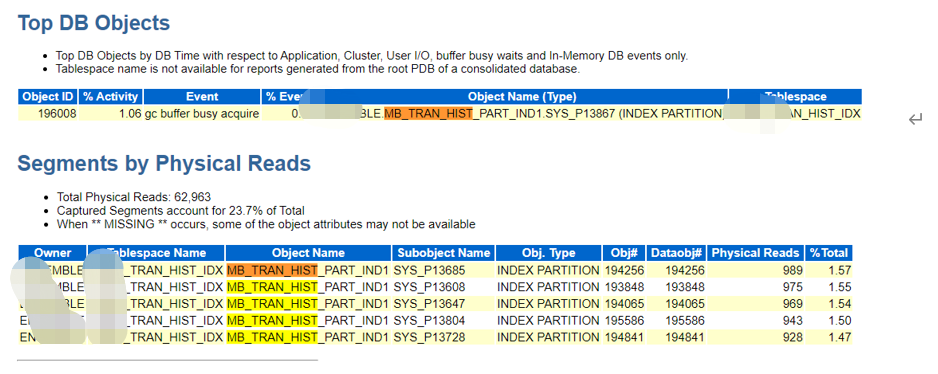
查看下索引状态都正常
select * from dba_indexes where table_name = 'MB_TRAN_HIST'
select * from dba_part_indexes where table_name = 'MB_TRAN_HIST'
select * from dba_ind_partitions where index_name = 'MB_TRAN_HIST_PART_IND1'
查看历史会话
查看历史会话的sql event
select * from dba_hist_active_sess_history where SAMPLE_TIME BETWEEN
TO_DATE( '2021-3-10 6:55:00' , 'YYYY-MM-DD HH24:MI:SS' ) AND
TO_DATE( '2021-3-10 7:05:00' , 'YYYY-MM-DD HH24:MI:SS' ) and program = 'JDBC Thin Client' and sql_id = '9drqghdq6txpm'

定位到存在等待事件 read by other session
查看sql version
6:30~7:30的awr报告

6:30~7:30的awr报告

查看下官方read by other session的解释
Problem Confirmation:
- The time spent actively in the local database is significant
- Only certain sessions, queries or jobs are experiencing slowness (not throughout the database)
- The time spent actively waiting on 'read by other session' waits are the significant component of total DB Time
- Average time for 'read by other session' waits exceeds typical standards (ie takes greater than 40 mSec)
' read by other session' waits
Waits on 'read by other session' means that a session wants to pin a block that is currently being read from disk into the buffer cache by another session. This means that the first session needs to wait until this completes.
Reducing Number of Waits:
- If you are seeing long
delays taken to service this wait event then check the amount of I/O
being performed on the device identified by the P1 argument of this wait
event.
The device and / or the controller may be overloaded. If this is the case then take the standard steps of spreading the file across further devices etc. - Check that the real problem isn't the amount of time that the operating system is taking to service the system call.
- Find out which file numbers are causing the highest average waits and then determine which filesystem contains the file
- Determine why the filesystems are performing poorly. Some common causes are:
- "hot filesystems" - too many active files on the same filesystem exhausting the I/O bandwidth
- hardware problem
- In Parallel Execution (PX) is being used, determine if the I/O subsystem is saturated by having too many slaves in use.
确认问题
查询发生时间段详细信息
select * from dba_hist_active_sess_history
WHERE event = 'read by other session' and session_state = 'WAITING' and SAMPLE_TIME BETWEEN
TO_DATE( '2021-3-10 6:55:00' , 'YYYY-MM-DD HH24:MI:SS' ) AND
TO_DATE( '2021-3-10 7:05:00' , 'YYYY-MM-DD HH24:MI:SS' )

附注:
- file# Absolute File Number (AFN)
This is the file number of the data file that contains the block that the waiting session wants.
- block#
This is the block number in the above file# that the waiting session wants access to. See Note:181306.1 to determine the tablespace, filename and object for this file#,block# pair.
- class# Block class#
This is the class of block being waited on. In particular:
- class 1indicates a "data block", which could be table or index
- class 4indicates a "segment header"
- class >=15indicate undo blocks
热点块
SELECT relative_fno, owner, segment_name, segment_type
FROM dba_extents
WHERE file_id = 45
AND
332861
BETWEEN
block_id
AND
block_id + blocks -
1
;
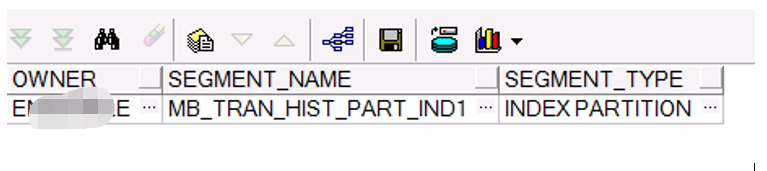
和上边awr一致。
blocking session
blocking session为 '390' , '1567',查询发现在7点时有不到20个session进来查询。
select * from dba_hist_active_sess_history where session_id in ( '390' , '1567' ) and SAMPLE_TIME BETWEEN
TO_DATE( '2021-3-10 6:5:00' , 'YYYY-MM-DD HH24:MI:SS' ) AND
TO_DATE( '2021-3-10 7:05:00' , 'YYYY-MM-DD HH24:MI:SS' )

查看索引数据分布
查看索引情况索引情况,发现热点索引是local的分区索引,每个分区内tran_date字段一样,原因定位了,让开发人员去掉索引去测试。

附:Sql语句
select count(*) as count from ( select * from mb_tran_hist where INTERNAL_KEY = :1 AND TRAN_DATE between :2 AND :3 AND TRAN_STATUS!='R' AND nvl(NARRATIVE, 'A') != 'xx' AND PARTNER_ID = :4 order by TRAN_TIMESTAMP DESC, SEQ_NO + 0 DESC ) temp
来自 “ ITPUB博客 ” ,链接:https://blog.itpub.net/69993564/viewspace-2762152/ ,如需转载,请注明出处,否则将追究法律责任。

最新文章
- [oracle] oracle定时清理回收站
- [mysql] 17.5 组复制(MGR)安全指南
- [mysql] 17.4 mysql MGR 组复制操作指南
- [mysql] 17.3 mysql MGR监控
- [mysql] 17.2. mysql MGR 安装参考手册(本地安装)
- [oracle] 修改分区表默认表空间
- [mysql] 17.2. mysql MGR 安装参考手册( Single-Primary Mode)
- [mysql] 17.1. mysql Group Replication(MGR)
- [tidb] 3.7.7 TiKV optimization(TiKV Server 优化)
- [mongo] {第六部分} mongodb replication V1
