原文链接: http://tecdat.cn/?p=17347
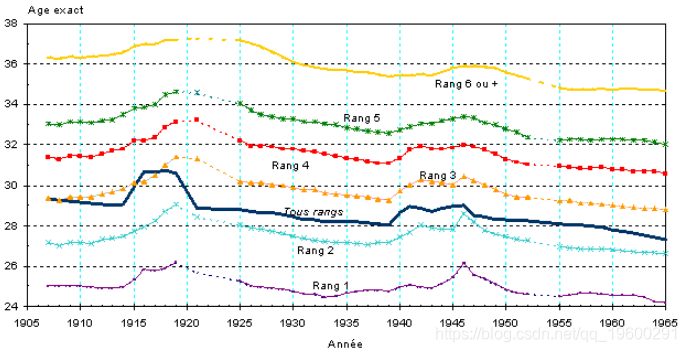
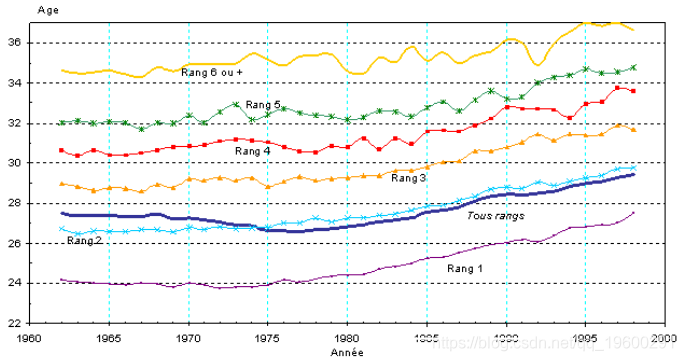
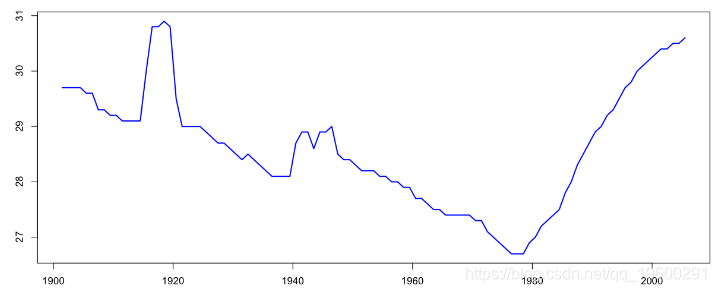
> age$Age=as.character(age$AGE)> age$AGE=as.numeric(substr(age$Age,1,2))++ as.numeric(substr(age$Age,4,4))/10> plot(age$ANNEE+.5,age$AGE,+ type="l",lwd=2,col="blue")
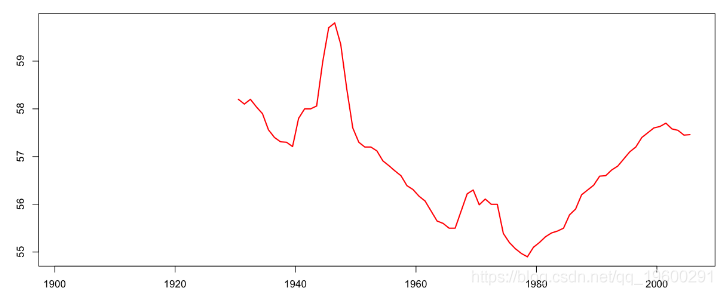
> tail(age)AGE Age NAIS.MERE NAIS.GRD.MERE age.GRD.MERE2000 2000 30.3 30,3 1970.2 1942.87 57.632001 2001 30.4 30,4 1971.1 1943.80 57.702002 2002 30.4 30,4 1972.1 1944.92 57.582003 2003 30.5 30,5 1973.0 1945.95 57.552004 2004 30.5 30,5 1974.0 1947.05 57.452005 2005 30.6 30,6 1974.9 1948.04 57.46> plot(age$ANNEE+.5,age$age.GRD.MERE,+ type="l",lwd=2,col="red")
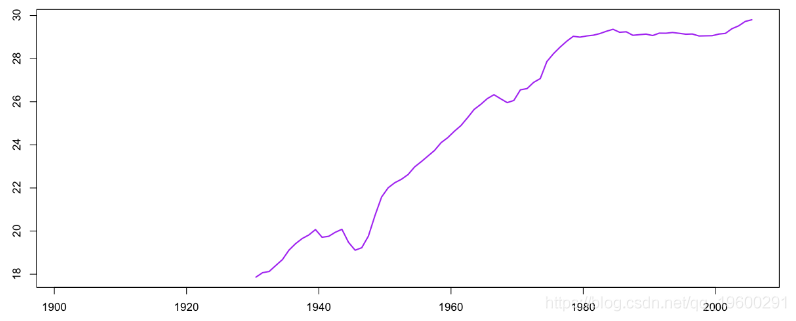
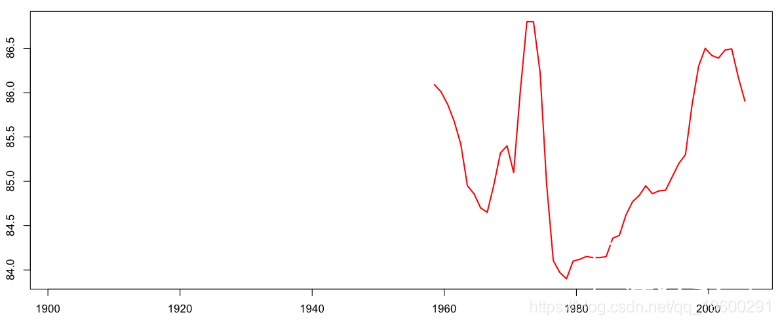
> Deces <- read.table("Dec.txt",header=TRUE)> Expo <- read.table("Expo.txt",header=TRUE,skip=2)> Deces$Age <- as.nu> Expo$Age <- as.numeric(as.character(Expo$Age))> Expo$Age[is.nDeces$Female/Expo$Female,nL,nC)> POPF <- matrix(Expo$Female,nL,nC)> BASEF <- demogdata(data=MUF, pop=POPF,ages=AGE,+ years=YEAR, t> K1 <- LCF$ktnction(xentier,T){+ return(ext) }> EVIE = function(x,T){+ x1 <- trunc(x)> tail(age)AGE Age NAIS.MERE NAIS.GRD.MERE age.GRD.MERE EV2000 30.3 30,3 1970.2 1942.87 57.63 29.138762001 30.4 30,4 1971.1 1943.80 57.70 29.170472002 30.4 30,4 1972.1 1944.92 57.58 29.390272003 30.5 30,5 1973.0 1945.95 57.55 29.520412004 30.5 30,5 1974.0 1947.05 57.45 29.725112005 30.6 30,6 1974.9 1948.04 57.46 29.80398


精算科学
来自 “ ITPUB博客 ” ,链接:https://blog.itpub.net/69982319/viewspace-2728650/ ,如需转载,请注明出处,否则将追究法律责任。

请登录后发表评论
登录
全部评论
