oracle gc等待排查过程
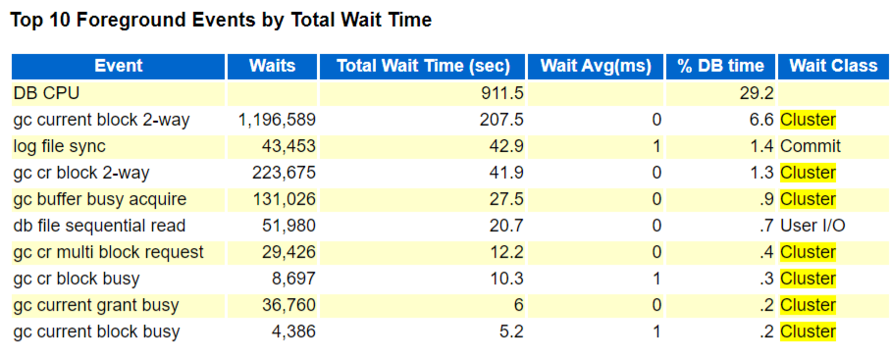
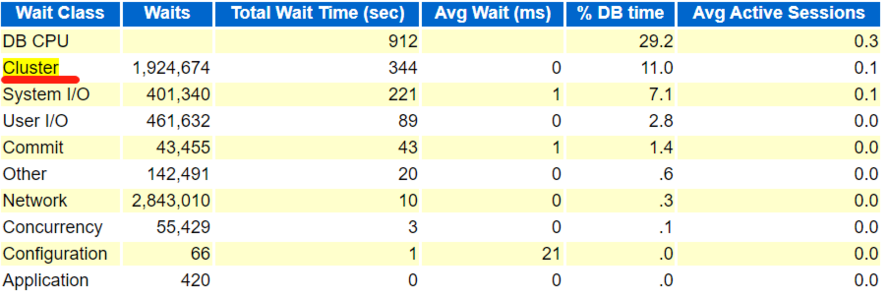
1.awr查看等待,确认是gc等待
1).
2).
3).
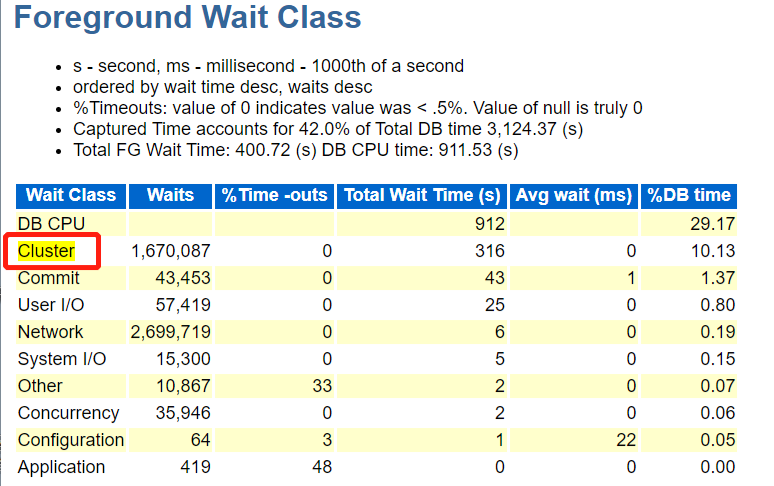
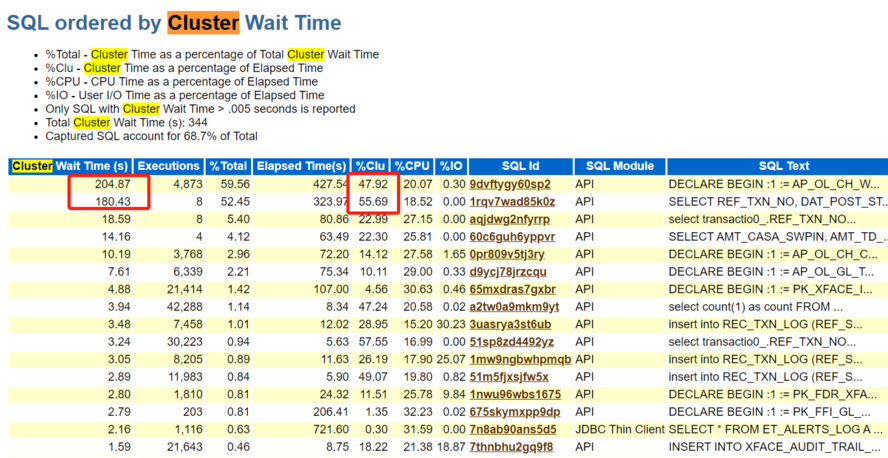
2.查看cluster wait time
确认语句
3.查看Segments by Global Cache Buffer Busy
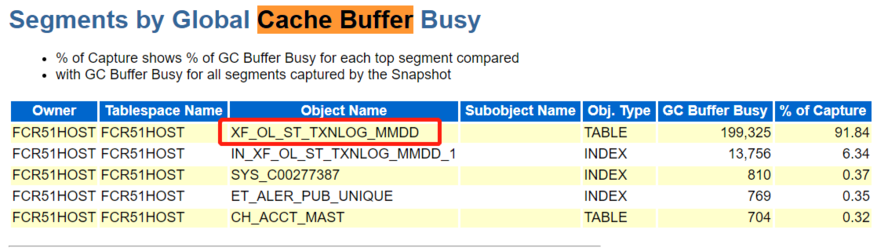
可以看到 gc(global cache) buffer busy的对象,下图可见XF_OL_ST_TXNLOG_MMDD表gc buffer busy占91.83%。
缩小问题范围,跟上面的语句去印证。
4.查看CR Blocks Received
已收到CR块比例较高的对象为XF_OL_ST_TXNLOG_MMDD,为实现一致性读,该表上存在大量的跨节点传输。

5.查看语句
根据2,3,4步骤相互印证,确认问题语句,获取到sql id。
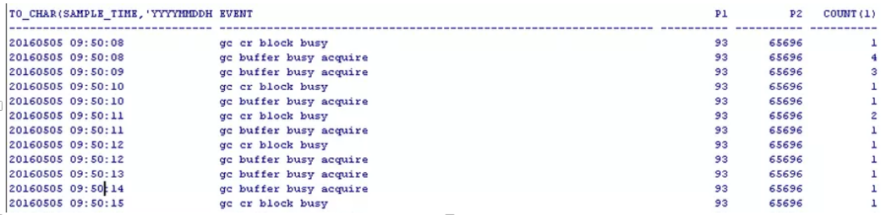
我的语句
select to_char(sample_time,'yyyymmdd hh24:mi:ss'),event,p1,p2,count(1) from gv$active_session_history
where sql_id='2h21bq1mnc5kd' and event like '%gc%' and inst_id=2 and SAMPLE_TIME<to_timestamp('20220214-16:00:00','YYYYMMDD-hh24:mi:ss') and
SAMPLE_TIME>to_timestamp('20220214-15:00:00','YYYYMMDD-hh24:mi:ss') group by
to_char(sample_time,'yyyymmdd hh24:mi:ss'),event,p1,p2;
来自 “ ITPUB博客 ” ,链接:https://blog.itpub.net/69980685/viewspace-3001651/ ,如需转载,请注明出处,否则将追究法律责任。

