1. show variables like '%profiling%';(查看profiling信息) 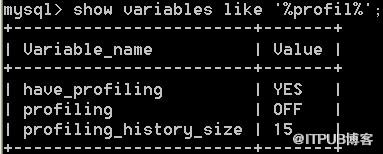
2. set profiling=1;(开启profiling) 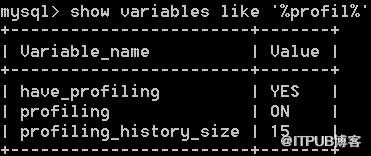
3. 执行SQL查询 例:select goods_name from ecs_goods where goods_id  4. show profile for query 4;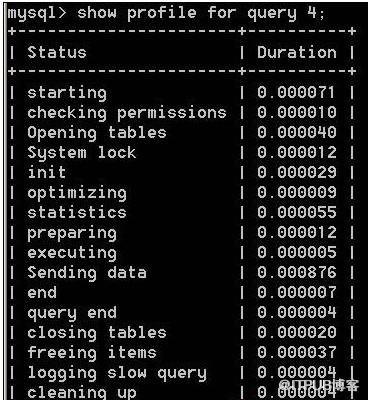
show profile 的格式如下:
SHOW PROFILE [type [, type] ... ] [FOR QUERY n] [LIMIT row_count [OFFSET offset]] type: ALL| BLOCK IO| CONTEXT SWITCHES| CPU| IPC| MEMORY| PAGE FAULTS| SOURCE| SWAPS
来自 “ ITPUB博客 ” ,链接:https://blog.itpub.net/4240/viewspace-2804023/ ,如需转载,请注明出处,否则将追究法律责任。
上一篇:
Python2.x
下一篇:
MySQL Order By语法介绍

请登录后发表评论
登录
全部评论
