https://blog.csdn.net/zy5757/article/details/77742917
分析ORACLE的AWR报告时,发现SQL ordered by Executions(记录了按照SQL的执行次数排序的TOP SQL。该排序可以看出监控范围内的SQL执行次数)下有一个SQL语句执行非常频繁,一个小时执行了上万次:
update seq$ set increment$=:2, minvalue=:3, maxvalue=:4, cycle#=:5, order$=:6, cache=:7, highwater=:8, audit$=:9, flags=:10 where obj#=:1
那么seq$这个数据字典表是做什么用的呢? 其实这个数据字典表是保存的是数据库下序列对象(SEQUENCE)的相关信息,而且它用来维护序列的变化。如下所示,我们通过实验来验证一下,我们启用10046事件,跟踪一下会话(level=4 表示启用SQL_TRACE并捕捉跟踪文件中的绑定变量),我们跟踪会话创建序列的过程。
下面测试环境为Oracle 11g
SQL> show user
USER is "HR"
SQL> alter session set events '10046 trace name context forever, level 4';
Session altered.
SQL> create sequence my_sequence_test start with 1 increment by 1 maxvalue 999999999 nocache;
Sequence created.
SQL> alter session set events '10046 trace name context off';
Session altered.
使用tkprof将跟踪文件转换成可读格式的文件后,你会注意到:在创建序列时,会往数据字典表seq$中插入一条记录(其实创建序列的本质就是在seq$和obj$中插入了一条记录),在trace文件的最后有如下记录:
********************************************************************************
SQL ID: acd938p9jb374 Plan Hash: 0
insert into seq$(obj#,increment$,minvalue,maxvalue,cycle#,order$,cache,
highwater,audit$,flags)
values
(:1,:2,:3,:4,:5,:6,:7,:8,:9,:10)
call count cpu elapsed disk query current rows
------- ------ -------- ---------- ---------- ---------- ---------- ----------
Parse 1 0.00 0.00 0 0 0 0
Execute 1 0.00 0.00 1 1 4 1
Fetch 0 0.00 0.00 0 0 0 0
------- ------ -------- ---------- ---------- ---------- ---------- ----------
total 2 0.00 0.00 1 1 4 1
Misses in library cache during parse: 1
Misses in library cache during execute: 1
Optimizer mode: CHOOSE
Parsing user id: SYS (recursive depth: 1)
Number of plan statistics captured: 1
Rows (1st) Rows (avg) Rows (max) Row Source Operation
---------- ---------- ---------- ---------------------------------------------------
0 0 0 LOAD TABLE CONVENTIONAL (cr=1 pr=1 pw=0 time=150 us)
********************************************************************************
tkprof格式化后的输出文件里面,没有绑定变量,在原始跟踪文件DBdb_ora_1735.trc中,你可以看到对应绑定变量的值,如下:
=====================
PARSING IN CURSOR #139865487614776 len=132 dep=1 uid=0 oct=2 lid=0 tim=1547602293884543 hv=1393921252 ad='723ed1c8' sqlid='acd938p9jb374'
insert into seq$(obj#,increment$,minvalue,maxvalue,cycle#,order$,cache,highwater,audit$,flags)values(:1,:2,:3,:4,:5,:6,:7,:8,:9,:10)
END OF STMT
PARSE #139865487614776:c=127,e=361,p=0,cr=0,cu=0,mis=1,r=0,dep=1,og=4,plh=0,tim=1547602293884542
BINDS #139865487614776:
Bind#0
oacdty=02 mxl=22(22) mxlc=00 mal=00 scl=00 pre=00
oacflg=00 fl2=0001 frm=00 csi=00 siz=24 off=0
kxsbbbfp=7f34f8c55cb8 bln=22 avl=04 flg=05
value= 90097
Bind#1
oacdty=02 mxl=22(02) mxlc=00 mal=00 scl=00 pre=00
oacflg=10 fl2=0001 frm=00 csi=00 siz=24 off=0
kxsbbbfp=723c7770 bln=22 avl=02 flg=09
value=1
Bind#2
oacdty=02 mxl=22(02) mxlc=00 mal=00 scl=00 pre=00
oacflg=10 fl2=0001 frm=00 csi=00 siz=24 off=0
kxsbbbfp=723c7782 bln=22 avl=02 flg=09
value=1
Bind#3
oacdty=02 mxl=22(06) mxlc=00 mal=00 scl=00 pre=00
oacflg=10 fl2=0001 frm=00 csi=00 siz=24 off=0
kxsbbbfp=723c7794 bln=22 avl=06 flg=09
value=999999999
Bind#4
oacdty=02 mxl=22(22) mxlc=00 mal=00 scl=00 pre=00
oacflg=00 fl2=0001 frm=00 csi=00 siz=48 off=0
kxsbbbfp=7f34f8c55c70 bln=22 avl=01 flg=05
value=0
Bind#5
oacdty=02 mxl=22(22) mxlc=00 mal=00 scl=00 pre=00
oacflg=00 fl2=0001 frm=00 csi=00 siz=0 off=24
kxsbbbfp=7f34f8c55c88 bln=22 avl=01 flg=01
value=0
Bind#6
oacdty=02 mxl=22(01) mxlc=00 mal=00 scl=00 pre=00
oacflg=10 fl2=0001 frm=00 csi=00 siz=24 off=0
kxsbbbfp=723c77a6 bln=22 avl=01 flg=09
value=0
Bind#7
oacdty=02 mxl=22(02) mxlc=00 mal=00 scl=00 pre=00
oacflg=10 fl2=0001 frm=00 csi=00 siz=24 off=0
kxsbbbfp=723c77b8 bln=22 avl=02 flg=09
value=1
Bind#8
oacdty=01 mxl=32(32) mxlc=00 mal=00 scl=00 pre=00
oacflg=10 fl2=0001 frm=01 csi=852 siz=32 off=0
kxsbbbfp=723c77ca bln=32 avl=32 flg=09
value="--------------------------------"
Bind#9
oacdty=02 mxl=22(22) mxlc=00 mal=00 scl=00 pre=00
oacflg=00 fl2=0001 frm=00 csi=00 siz=24 off=0
kxsbbbfp=7f34f8c55c40 bln=22 avl=02 flg=05
value=8
EXEC #139865487614776:c=497,e=602,p=1,cr=1,cu=4,mis=1,r=1,dep=1,og=4,plh=0,tim=1547602293885236
STAT #139865487614776 id=1 cnt=0 pid=0 pos=1 obj=0 op='LOAD TABLE CONVENTIONAL (cr=1 pr=1 pw=0 time=150 us)'
CLOSE #139865487614776:c=0,e=2,dep=1,type=3,tim=1547602293885267
=====================
使用下面脚本,你就会发现这个都是对应序列对象的一些信息(序列对象的OBJECT_ID、MINVALUE、MAXVALUE、CACHE等等):
SQL> select obj#,increment$,minvalue,maxvalue,cycle#,cache,highwater from seq$ where obj#=90097;
OBJ# INCREMENT$ MINVALUE MAXVALUE CYCLE# CACHE HIGHWATER
---------- ---------- ---------- ---------- ---------- ---------- ----------
90097 1 1 999999999 0 0 1
SQL> select object_type,object_name from dba_objects where object_id=90097;
OBJECT_TYPE OBJECT_NAME
------------------- ------------------------------
SEQUENCE MY_SEQUENCE_TEST
SQL> select * from dba_sequences where sequence_name='MY_SEQUENCE_TEST';
SEQUENCE_OWNER SEQUENCE_NAME MIN_VALUE MAX_VALUE INCREMENT_BY C O CACHE_SIZE LAST_NUMBER
------------------------------ ------------------------------ ---------- ---------- ------------ - - ---------- -----------
HR MY_SEQUENCE_TEST 1 999999999 1 N N 0 1
那么,我们接下来使用SQL TRACE看看使用SEQUENCE时,会对seq$表有啥操作。如下所示,我们在启用SQL_TRACE后,执行3次该SQL语句
SQL> select my_sequence_test.currval, my_sequence_test.nextval from dual;
CURRVAL NEXTVAL
---------- ----------
1 1
SQL> alter session set sql_trace=true;
Session altered.
SQL> select my_sequence_test.currval, my_sequence_test.nextval from dual;
CURRVAL NEXTVAL
---------- ----------
2 2
SQL> select my_sequence_test.currval, my_sequence_test.nextval from dual;
CURRVAL NEXTVAL
---------- ----------
3 3
SQL> select my_sequence_test.currval, my_sequence_test.nextval from dual;
CURRVAL NEXTVAL
---------- ----------
4 4
SQL> alter session set sql_trace=false;
Session altered.
在跟踪文件中(具体过程跟上面查看跟踪文件类似,在此忽略具体过程),你会看到也对seq$做了三次更新,更新HIGHWATER的值。
select my_sequence_test.currval, my_sequence_test.nextval
from
dual
update seq$ set increment$=:2,minvalue=:3,maxvalue=:4,cycle#=:5,order$=:6,
cache=:7,highwater=:8,audit$=:9,flags=:10
where
obj#=:1
********************************************************************************
SQL ID: d6jrus83jv6p2 Plan Hash: 1070122491
select my_sequence_test.currval, my_sequence_test.nextval
from
dual
call count cpu elapsed disk query current rows
------- ------ -------- ---------- ---------- ---------- ---------- ----------
Parse 3 0.00 0.00 0 0 0 0
Execute 【3】 0.00 0.00 0 0 0 0
Fetch 6 0.00 0.00 0 0 3 3
------- ------ -------- ---------- ---------- ---------- ---------- ----------
total 12 0.00 0.00 0 0 3 3
Misses in library cache during parse: 1
Optimizer mode: ALL_ROWS
Parsing user id: 84
Number of plan statistics captured: 3
Rows (1st) Rows (avg) Rows (max) Row Source Operation
---------- ---------- ---------- ---------------------------------------------------
1 1 1 SEQUENCE MY_SEQUENCE_TEST (cr=1 pr=0 pw=0 time=249 us)
1 1 1 FAST DUAL (cr=0 pr=0 pw=0 time=1 us cost=2 size=0 card=1)
********************************************************************************
SQL ID: 4m7m0t6fjcs5x Plan Hash: 1935744642
update seq$ set increment$=:2,minvalue=:3,maxvalue=:4,cycle#=:5,order$=:6,
cache=:7,highwater=:8,audit$=:9,flags=:10
where
obj#=:1
call count cpu elapsed disk query current rows
------- ------ -------- ---------- ---------- ---------- ---------- ----------
Parse 0 0.00 0.00 0 0 0 0
Execute 【3】 0.00 0.00 0 3 6 3
Fetch 0 0.00 0.00 0 0 0 0
------- ------ -------- ---------- ---------- ---------- ---------- ----------
total 3 0.00 0.00 0 3 6 3
Misses in library cache during parse: 0
Optimizer mode: CHOOSE
Parsing user id: SYS (recursive depth: 1)
********************************************************************************
那么我们接下来,我们修改序列CACHE属性的值,然后重复上面操作,如下所示,在跟踪文件里面,你会看到只更新了seq$一次,其实更新seq$的更新次数是跟CACHE的值有关系的。所以适当的使用CACHE,是可以减少更新seq$数据字典表的次数。
SQL> alter sequence my_sequence_test cache 10;
Sequence altered.
SQL> alter session set sql_trace=true;
Session altered.
SQL> select my_sequence_test.currval, my_sequence_test.nextval from dual;
CURRVAL NEXTVAL
---------- ----------
5 5
SQL> select my_sequence_test.currval, my_sequence_test.nextval from dual;
CURRVAL NEXTVAL
---------- ----------
6 6
SQL> select my_sequence_test.currval, my_sequence_test.nextval from dual;
CURRVAL NEXTVAL
---------- ----------
7 7
SQL> alter session set sql_trace=false;
Session altered.
再次查看跟踪文件:
********************************************************************************
SQL ID: d6jrus83jv6p2 Plan Hash: 1070122491
select my_sequence_test.currval, my_sequence_test.nextval
from
dual
call count cpu elapsed disk query current rows
------- ------ -------- ---------- ---------- ---------- ---------- ----------
Parse 6 0.00 0.00 0 0 0 0
Execute 6 0.00 0.00 0 0 0 0
Fetch 12 0.00 0.00 0 0 4 6
------- ------ -------- ---------- ---------- ---------- ---------- ----------
total 24 0.00 0.00 0 0 4 6
Misses in library cache during parse: 2
Optimizer mode: ALL_ROWS
Parsing user id: 84
Number of plan statistics captured: 5
Rows (1st) Rows (avg) Rows (max) Row Source Operation
---------- ---------- ---------- ---------------------------------------------------
1 1 1 SEQUENCE MY_SEQUENCE_TEST (cr=1 pr=0 pw=0 time=155 us)
1 1 1 FAST DUAL (cr=0 pr=0 pw=0 time=1 us cost=2 size=0 card=1)
********************************************************************************
SQL ID: 4m7m0t6fjcs5x Plan Hash: 1935744642
update seq$ set increment$=:2,minvalue=:3,maxvalue=:4,cycle#=:5,order$=:6,
cache=:7,highwater=:8,audit$=:9,flags=:10
where
obj#=:1
call count cpu elapsed disk query current rows
------- ------ -------- ---------- ---------- ---------- ---------- ----------
Parse 0 0.00 0.00 0 0 0 0
Execute 4 0.00 0.00 0 4 8 4
Fetch 0 0.00 0.00 0 0 0 0
------- ------ -------- ---------- ---------- ---------- ---------- ----------
total 4 0.00 0.00 0 4 8 4
Misses in library cache during parse: 0
Optimizer mode: CHOOSE
Parsing user id: SYS (recursive depth: 1)
********************************************************************************
可以看到原来对my_sequence_test的执行次数由3次增加到6次,执行了3次;而对seq$表的更新由3次增加到了4次,执行了1次。
那么我们接下来创建一个表,然后循环递归调用序列,然后生成对应时间段的AWR报告,我们来重现一下生产环境遇到的问题:
SQL> create table test(id number);
Table created.
SQL> begin
2 for row_num in 1 .. 50000 loop
3 insert into test
4 select my_sequence_test.nextval from dual;
5 commit;
6 end loop;
7 end;
8 /
PL/SQL procedure successfully completed.
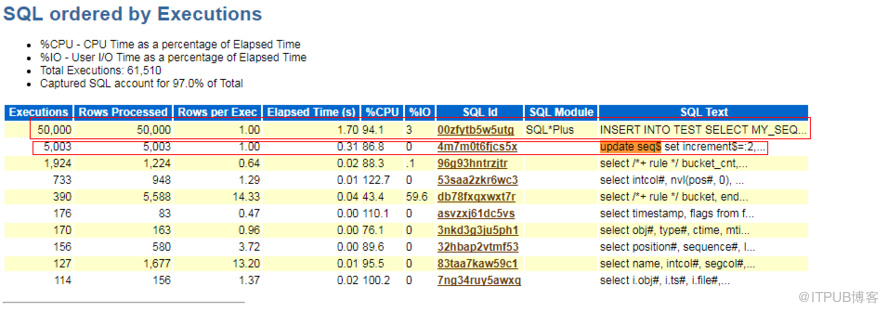
如下所示,你看到INSERT语句执行了50000次(5万),而更新seq$执行了5003次(5千03),因为上面测试将序列的CACHE设置为10了,如果没有设置CACHE,那么序列被调用50000次,更新seq$对象也将更新50000次。
另外,调用序列也会有一些redo log开销,如下测试所示,我们先将序列设置为NOCACHE,然后测试过程发现,每次执行都有900多大小的redo log生成。
SQL> alter sequence my_sequence_test nocache;
Sequence altered.
SQL> set autotrace on;
SQL> select my_sequence_test.nextval from dual;
NEXTVAL
----------
50015
Execution Plan
----------------------------------------------------------
Plan hash value: 1070122491
-----------------------------------------------------------------------------
| Id | Operation | Name | Rows | Cost (%CPU)| Time |
-----------------------------------------------------------------------------
| 0 | SELECT STATEMENT | | 1 | 2 (0)| 00:00:01 |
| 1 | SEQUENCE | MY_SEQUENCE_TEST | | | |
| 2 | FAST DUAL | | 1 | 2 (0)| 00:00:01 |
-----------------------------------------------------------------------------
Statistics
----------------------------------------------------------
16 recursive calls
3 db block gets
16 consistent gets
0 physical reads
676 redo size
527 bytes sent via SQL*Net to client
519 bytes received via SQL*Net from client
2 SQL*Net roundtrips to/from client
4 sorts (memory)
0 sorts (disk)
1 rows processed
SQL> select my_sequence_test.nextval from dual;
NEXTVAL
----------
50016
Execution Plan
----------------------------------------------------------
Plan hash value: 1070122491
-----------------------------------------------------------------------------
| Id | Operation | Name | Rows | Cost (%CPU)| Time |
-----------------------------------------------------------------------------
| 0 | SELECT STATEMENT | | 1 | 2 (0)| 00:00:01 |
| 1 | SEQUENCE | MY_SEQUENCE_TEST | | | |
| 2 | FAST DUAL | | 1 | 2 (0)| 00:00:01 |
-----------------------------------------------------------------------------
Statistics
----------------------------------------------------------
1 recursive calls
3 db block gets
1 consistent gets
0 physical reads
676 redo size
527 bytes sent via SQL*Net to client
519 bytes received via SQL*Net from client
2 SQL*Net roundtrips to/from client
0 sorts (memory)
0 sorts (disk)
1 rows processed
如果使用CACHE的sequence对象而言,redo size生成的频率显然是低得多。如下所示,测试三次,只有第一次生成了redo log, 当然这个是跟序列的CACHE值有关,当缓存的序列值使用完了,生成新的序列值缓存时,也会产生redo log。
SQL> alter sequence my_sequence_test cache 10;
Sequence altered.
SQL> select my_sequence_test.nextval from dual;
NEXTVAL
----------
50017
Execution Plan
----------------------------------------------------------
Plan hash value: 1070122491
-----------------------------------------------------------------------------
| Id | Operation | Name | Rows | Cost (%CPU)| Time |
-----------------------------------------------------------------------------
| 0 | SELECT STATEMENT | | 1 | 2 (0)| 00:00:01 |
| 1 | SEQUENCE | MY_SEQUENCE_TEST | | | |
| 2 | FAST DUAL | | 1 | 2 (0)| 00:00:01 |
-----------------------------------------------------------------------------
Statistics
----------------------------------------------------------
3 recursive calls
3 db block gets
3 consistent gets
0 physical reads
684 redo size
527 bytes sent via SQL*Net to client
519 bytes received via SQL*Net from client
2 SQL*Net roundtrips to/from client
0 sorts (memory)
0 sorts (disk)
1 rows processed
SQL> select my_sequence_test.nextval from dual;
NEXTVAL
----------
50018
Execution Plan
----------------------------------------------------------
Plan hash value: 1070122491
-----------------------------------------------------------------------------
| Id | Operation | Name | Rows | Cost (%CPU)| Time |
-----------------------------------------------------------------------------
| 0 | SELECT STATEMENT | | 1 | 2 (0)| 00:00:01 |
| 1 | SEQUENCE | MY_SEQUENCE_TEST | | | |
| 2 | FAST DUAL | | 1 | 2 (0)| 00:00:01 |
-----------------------------------------------------------------------------
Statistics
----------------------------------------------------------
0 recursive calls
0 db block gets
0 consistent gets
0 physical reads
0 redo size
527 bytes sent via SQL*Net to client
519 bytes received via SQL*Net from client
2 SQL*Net roundtrips to/from client
0 sorts (memory)
0 sorts (disk)
1 rows processed
SQL> select my_sequence_test.nextval from dual;
NEXTVAL
----------
50019
Execution Plan
----------------------------------------------------------
Plan hash value: 1070122491
-----------------------------------------------------------------------------
| Id | Operation | Name | Rows | Cost (%CPU)| Time |
-----------------------------------------------------------------------------
| 0 | SELECT STATEMENT | | 1 | 2 (0)| 00:00:01 |
| 1 | SEQUENCE | MY_SEQUENCE_TEST | | | |
| 2 | FAST DUAL | | 1 | 2 (0)| 00:00:01 |
-----------------------------------------------------------------------------
Statistics
----------------------------------------------------------
0 recursive calls
0 db block gets
0 consistent gets
0 physical reads
0 redo size
527 bytes sent via SQL*Net to client
519 bytes received via SQL*Net from client
2 SQL*Net roundtrips to/from client
0 sorts (memory)
0 sorts (disk)
1 rows processed
另外一个问题就是,如果序列是NOCACHE,并发调用序列时, 那么也会产生row lock contention, 所以给序列设置一个合适的CACHE值是有很大好处的,既能减少redo log的产生,也能避免减少row lock contention(并发更新seq$同一行记录)。但是序列设置了CACHE后,也有可能遇到跳号问题。那么这个就需要根据实际情况酌情考虑处理了。
来自 “ ITPUB博客 ” ,链接:https://blog.itpub.net/31397003/viewspace-2561480/ ,如需转载,请注明出处,否则将追究法律责任。

