LightningChart Ultimate使用教程:在WPF中绘制点线数据
- LightningChart Ultimate使用教程:在WPF中绘制点线数据
本教程讲述如何使用图表工具LightningChartUltimate PointLineSeries系列描绘变量区间点线数据。
学习该教程,你需要具备:
- 基本C#和Visual Studio 2010知识
- 安装LightningChartUltimate v5.1 (.NET4)
- Visual Studio 2010或更高环境
1、添加LightningChartUltimate控件
建立一个WPF应用程序。在e Visual Studio工具栏中拖放组件"LightningChartUltimate"到表格窗口编辑器。

窗口编辑器如下图:
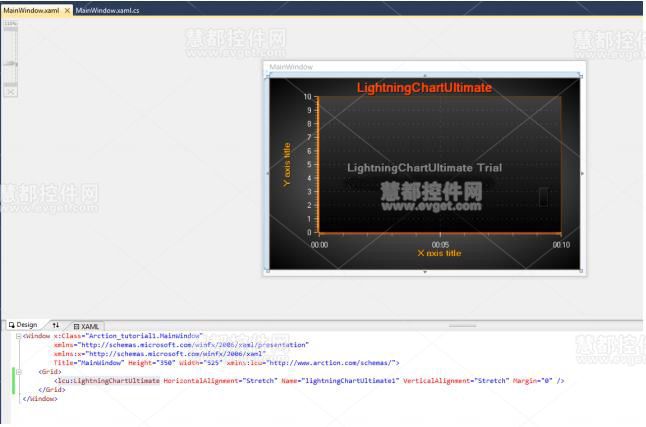
代码如下:
|
1
2
3
4
5
|
|
2、初始化LightningChart组件
编辑MainWindow.xaml.cs源代码,用自定义外观设置和随机数据初始化。代码如下:
|
1
2
3
4
5
6
7
8
9
10
11
12
13
14
15
16
17
18
19
20
21
22
23
24
25
26
27
28
29
30
31
32
33
34
35
36
37
38
39
40
41
42
43
44
45
46
47
48
49
50
51
52
53
54
55
56
57
58
59
60
61
62
63
64
65
66
67
68
69
70
71
72
73
74
75
76
77
78
79
80
81
|
/* Tutorial:
* Simple LightningChart WPF application
*/
using System;
using System.Collections.Generic;
using System.Linq;
using System.Text;
using System.Windows;
using System.Windows.Controls;
using System.Windows.Data;
using System.Windows.Documents;
using System.Windows.Input;
using System.Windows.Media;
using System.Windows.Media.Imaging;
using System.Windows.Navigation;
using System.Windows.Shapes;
using Arction.WPF.LightningChartUltimate;
using Arction.WPF.LightningChartUltimate.Views.ViewXY;
using Arction.WPF.LightningChartUltimate.SeriesXY;
using Arction.WPF.LightningChartUltimate.Axes;
//Make sure to use namespace similar to project name
namespace Arction_tutorial1
{
///
/// Interaction logic for MainWindow.xaml
///
public partial class MainWindow : Window
{
public MainWindow()
{
InitializeComponent();
InitializeChart();
}
private void InitializeChart()
{
//Initialize chart
lightningChartUltimate1.BeginUpdate();
//Get XY view
ViewXY chartView = lightningChartUltimate1.ViewXY;
//Get default x-axis and set the range and ValueType
AxisX axisX = chartView.XAxes[0];
axisX.SetRange(0, 20);
axisX.ValueType = AxisValueType.Number;
//Get default y-axis and set the range.
AxisY axisY = chartView.YAxes[0];
axisY.SetRange(0, 100);
//Add point line series
PointLineSeries pls = new PointLineSeries(chartView, axisX, axisY);
pls.PointsVisible = true;
//Generate random data
Random rand = new Random();
const double dInterval = 1;
int iPointCount = (int)((axisX.Maximum - axisX.Minimum) / dInterval) + 1;
SeriesPoint[] aPoints = new SeriesPoint[iPointCount];
for (int iPoint = 0; iPoint < iPointCount; iPoint++)
{
aPoints[iPoint].X = (double)iPoint;
aPoints[iPoint].Y = 100.0 * rand.NextDouble();
}
//Assign the data for the point line series
pls.Points = aPoints;
//Add series to the PointLineSeries container in the view
chartView.PointLineSeries.Add(pls);
//Apply chart property changes, which causes chart to be painted
lightningChartUltimate1.EndUpdate();
}
}
}
|
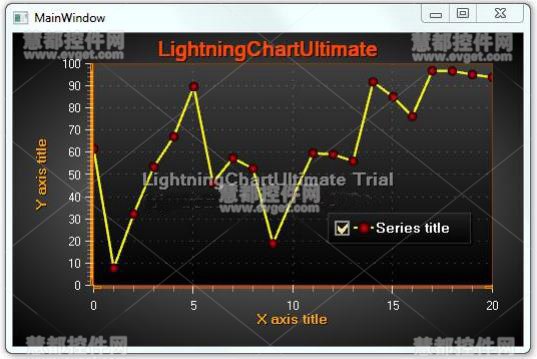
编译并运行这个程序,结果如下图所示:
文章转载自:慧都控件网 [http://www.evget.com]
来自 “ ITPUB博客 ” ,链接:https://blog.itpub.net/30080291/viewspace-1655767/ ,如需转载,请注明出处,否则将追究法律责任。

请登录后发表评论
登录
全部评论
最新文章
- LightningChart Ultimate使用教程:使用SampleDataSeries进行实时监测
- LightningChart Ultimate使用教程:在winform中绘制点线数据
- LightningChart Ultimate SDK教程:选择目标框架
- 示例:工控仪表控件Iocomp ActiveX系列教程:添加CAB文件到HTML页面
- 示例:工控仪表控件Iocomp ActiveX系列教程:LPK文件授权
- 使用iocomp中iplot控件实现接收串口数据并显示曲线
- 工业仪表盘控件Iocomp ActiveX/VCL更新至v4.0.8 SP4
- 工控图表工具Iocomp .NET WinForm v4.0 SP3发布
- Iocomp包含组件介绍(四)
- Iocomp包含组件介绍(三)
