2016年9月21日,广州地区技术负责人申告新版审核系统执行ETL抽数时,PLSQL及应用程序报ORA12518,如下图所示:
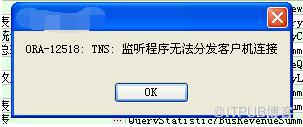
我的处理思路是,登录数据库服务器,查看数据库服务器状态是否正常,查看winserver2008R2的内存64G使用28G正常,系统资源监视器显示磁盘及网络情况都很空闲。
然后,通过调用操作系统cmd,使用lsnrctl status查看监听正常;登录sqlplus,发现从服务器端可以登录;通过sql>show parameter dump,查看数据库告警日志,有大量如下告警:
Wed Sep 21 16:06:34 2016
ORA-00020: maximum number of processes (150) exceeded
ORA-20 errors will not be written to the alert log for
the next minute. Please look at trace files to see all
the ORA-20 errors.
Wed Sep 21 16:08:15 2016
ORA-00020: maximum number of processes (150) exceeded
ORA-20 errors will not be written to the alert log for
the next minute. Please look at trace files to see all
the ORA-20 errors.
Wed Sep 21 16:09:33 2016
ORA-00020: maximum number of processes (150) exceeded
ORA-20 errors will not be written to the alert log for
the next minute. Please look at trace files to see all
the ORA-20 errors.
Wed Sep 21 16:09:48 2016
Process m000 submission failed with error = 20
Wed Sep 21 16:11:12 2016
ORA-00020: maximum number of processes (150) exceeded
ORA-20 errors will not be written to the alert log for
the next minute. Please look at trace files to see all
the ORA-20 errors.
到此,问题定位基本完成,问题出在数据库进程数Processes设置是150的默认配置,数据库进程数过低导致新版审核系统无法正常连接数据库的,
通过sql>show parameter processes 也能确定当前数据库服务器的processes配置确实是150过低。
问题处理方法很简单,就是修改数据库的进程数配置;需要注意的是,processes是静态参数,修改需要重启数据库服务才能生效;数据库进程数修改命令:
alter system set processes=500 scope = spfile;
重启数据库服务后,登录sqlplus,通过sql>show parameter processes 复查修改是否生效。
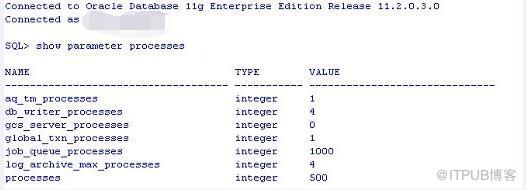
另外,除了processes进程过低可能导致ORA-12518外,监听程序异常、监听专享及共享模式、windows32位操作系统单进程1.7G内存使用限制也可能导致ORA-12518。
监听状态检查,通过lsnrctl status可以查看,也可以查看监听的日志(如果数据库监听启动了日记记录的话);
对于监听服务模式,通过命令查看 sql>show parameter shared_servers; sql>show parameter dispatchers; 如果监听是共享模式,可以通过如下语句查看共享分发器数量:
SELECT NAME, NETWORK FROM V$DISPATCHER;
总结:ORA-12518及ORA-00020的诱因有数据库进程数及会话数、监听分发器数目、windows32位单进程内存1.7G使用限制,处理问题的原则是先确定服务器内存、网络、CPU使用率正常,
数据库监听正常;然后,查看数据库的告警日志,一般能够很快定位到问题的具体原因,最后对症下药即可。
我的处理思路是,登录数据库服务器,查看数据库服务器状态是否正常,查看winserver2008R2的内存64G使用28G正常,系统资源监视器显示磁盘及网络情况都很空闲。
然后,通过调用操作系统cmd,使用lsnrctl status查看监听正常;登录sqlplus,发现从服务器端可以登录;通过sql>show parameter dump,查看数据库告警日志,有大量如下告警:
Wed Sep 21 16:06:34 2016
ORA-00020: maximum number of processes (150) exceeded
ORA-20 errors will not be written to the alert log for
the next minute. Please look at trace files to see all
the ORA-20 errors.
Wed Sep 21 16:08:15 2016
ORA-00020: maximum number of processes (150) exceeded
ORA-20 errors will not be written to the alert log for
the next minute. Please look at trace files to see all
the ORA-20 errors.
Wed Sep 21 16:09:33 2016
ORA-00020: maximum number of processes (150) exceeded
ORA-20 errors will not be written to the alert log for
the next minute. Please look at trace files to see all
the ORA-20 errors.
Wed Sep 21 16:09:48 2016
Process m000 submission failed with error = 20
Wed Sep 21 16:11:12 2016
ORA-00020: maximum number of processes (150) exceeded
ORA-20 errors will not be written to the alert log for
the next minute. Please look at trace files to see all
the ORA-20 errors.
到此,问题定位基本完成,问题出在数据库进程数Processes设置是150的默认配置,数据库进程数过低导致新版审核系统无法正常连接数据库的,
通过sql>show parameter processes 也能确定当前数据库服务器的processes配置确实是150过低。
问题处理方法很简单,就是修改数据库的进程数配置;需要注意的是,processes是静态参数,修改需要重启数据库服务才能生效;数据库进程数修改命令:
alter system set processes=500 scope = spfile;
重启数据库服务后,登录sqlplus,通过sql>show parameter processes 复查修改是否生效。
另外,除了processes进程过低可能导致ORA-12518外,监听程序异常、监听专享及共享模式、windows32位操作系统单进程1.7G内存使用限制也可能导致ORA-12518。
监听状态检查,通过lsnrctl status可以查看,也可以查看监听的日志(如果数据库监听启动了日记记录的话);
对于监听服务模式,通过命令查看 sql>show parameter shared_servers; sql>show parameter dispatchers; 如果监听是共享模式,可以通过如下语句查看共享分发器数量:
SELECT NAME, NETWORK FROM V$DISPATCHER;
总结:ORA-12518及ORA-00020的诱因有数据库进程数及会话数、监听分发器数目、windows32位单进程内存1.7G使用限制,处理问题的原则是先确定服务器内存、网络、CPU使用率正常,
数据库监听正常;然后,查看数据库的告警日志,一般能够很快定位到问题的具体原因,最后对症下药即可。
来自 “ ITPUB博客 ” ,链接:https://blog.itpub.net/29357786/viewspace-2125304/ ,如需转载,请注明出处,否则将追究法律责任。

请登录后发表评论
登录
全部评论
最新文章
- ORACLE 11.2.0.4 RAC Cluster not starting cssd with Cannot get GPnP profile
- oracle 19c打补丁遭遇OPATCHAUTO-72043&OPATCHAUTO-68061
- mysql GTID模式跳过错误GTID事务的正确方法
- oracle rac+adg调整redo日志组导致adg备库ogg抽取进程abend
- MySQL Linux服务器快照克隆引起的binlog日志无法正常删除导致文件系统满
- SQLServer 对象创建注意事项之dbo
- MongoDB 分片集群均衡器导致的性能下降
- SQLServer 难以接受的安全策略
- MongoDB server returned error on SASL authentication step: BSON field 'saslCo
- ORACLE expdp在表空间较多的情况下执行非常缓慢
