⑴ free
一个常见的问题是:
我的应用程序,服务器,用户以及系统进程等正在使用多少内存? 或者
现在多少内存可用?如果正在运行的进程使用的内存大于可用RAM,则需要将这些进程移到交换区
因此,一个补充的问题是:
正在使用多少交换区空间?
以上输出显示系统具有1011MB的RAM,已使用991MB,还有19MB内存可用
第二行显示在物理内存中缓冲区和缓存大小的更改
第三行显示交换分区利用情况
要以KB或GB为单位显示以上内容,请将-m选项分别替换为-k或-g。使用-b选项将以字节为单位
-t选项在输出底部显示总数(物理内存和交换分区的总和):
尽管free不显示百分比,但是我们可以提取并格式化输出的特定部分
例如:已用内存占总数的百分比
这个值非常重要,您可能希望在可用内存的百分比低于特定阀值时触发一个警报
同样,要发现已使用交换分区空间的百分比,您可以:
可以使用free查看应用程序施加的内存负载
例如,启动备份应用程序之前检查可用内存,启动之后立即检查可用内存
两者之差就是备份应用程序消耗的内存
针对Oracle用户的用法
那么您如何使用该命令管理运行Oracle环境的Linux服务器呢?
性能问题的一个最常见原因是内存不足,从而导致系统临时将内存区域"交换"到磁盘中
某种程度的交换可能是必然的,但交换过多则表示可用内存不足
而现在,您可以使用free获得可用内存信息,紧接着使用sar命令(稍后介绍)检查内存和交换分区的消耗的历史趋势
如果交换分区的使用是暂时的,则可能出现一个高峰,但如果明确要经过一段时间,则应要注意
持续的内存过载可能有几个明显且可能的疑点:
● 较大的SGA高于可用内存
● 在PGA上分配了大量内存
● 某些进程出现泄漏内存的错误
对于第一种情况,应确保SGA低于可用内存,根据经验,对SGA使用大约是物理内存的40%,当然,应该根据具体情况定义该参数
对于第二种情况,应尝试减少查询中的大量缓冲区的分配
对于第三种情况,应使用ps命令确定可能泄露内存的具体进程
⑵ ipcs
当某个进程运行时,它会夺取"共享内存"
该进程可能拥有一个或很多个共享内存段
进程之间彼此发送消息并使用信号
要显示有关共享内存段,IPC消息队列以及信号的信息,可以使用一个命令:
ipcs
-m选项非常受欢迎,他能显示共享内存段
该输出表明服务器正在运行Oracle软件,显示了各种共享内存段
每个共享内存段由显示在"shmid"列下面的共享内存ID唯一标识(稍后,您将看到如何使用该值)
显然,"owner"显示内存段的所有者,"perms"列显示权限,"bytes"显示字节大小
-u选项显示一个非常快速的摘要
-l显示限定值(相对于当前值):
如果您看到当前值处于或接近限定值,则应该考虑提高限定值
可以使用shmid值获取具体共享内存段的详细快照,-i选项可以完成该操作
下面是查看shmid 5505041 详细信息的方法:
稍后,本文将采用一个案例向您介绍如何解释以上输出
-s显示系统中的信号:
如果您增加信号,则总值必须低于内核参数(semmax)定义的上限
安装Oracle软件时,预安装的检查程序将检查semmax的设置
之后,当系统达到稳定状态时,您可以检查实际的利用情况,然后相应调整内核值
针对Oracle用户的用法
如何查看Oracle数据库实例使用的共享内存段?
为此,请使用oradebug命令
现在打开跟踪文件,将会看到共享内存ID(5505041)
下面是该文件的节选
可以使用共享内存ID来获取共享内存的详细信息
结合上面提到的ipcs -m -i 5505041
另一个有用的观察是lpid的值----最后一个接触共享内存段的进程的进程ID
要展示该属性值,使用SQL*PLUS从另一个会话连接到该实例
现在,针对同一个共享内存段再次执行ipcs命令
注意,lpid的值已经从原来的值10881更改为11476
lpid显示最后一个接触共享内存段的进程的PID
⑶ ipcrm
既然您已经标识了共享内存和其他IPC指标,那么使用它们做什么呢?
之前您看到过一些用法,如标识Oracle使用的共享内存,确保为共享内存设置了内核参数等等
另一个常见的应用是删除共享内存,IPC消息队列或信号组
要删除某个共享内存段,注意ipcs命令输出中它的shmid,然后使用-m选项删除该段,要删除ID为3735562段,使用:
这将删除该共享内存,还可以使用该命令删除信号和IPC消息队列(使用-s和-q参数)
针对Oracle用户的用法
有时当您关闭数据库实例时,Linux内核可能未完全清除共享内存段
留下的共享内存没有什么用处,但是它会占用系统资源,从而使可用于其他进程的内存更少
这种情况下,可以检查oracle用户所拥有的任何延迟共享内存段,然后删除它们,如果有这样的段,使用ipcrm删之
⑷ vmstat
vmstat是最早用于显示所有与内存和进程相关信息的命令
调用时,该命令持续运行并发布其信息
它有两个参数:
vmstat
是两次运行之间的时间间隔,以秒为单位
是vmstat重复的次数
下面是当我们希望vmstat每隔5秒运行一次并在第10次运行后停止时的例子
每5秒之后都会输出一行并显示此时的统计信息
该输出显示有关系统资源的大量信息,我们来详细介绍他们:
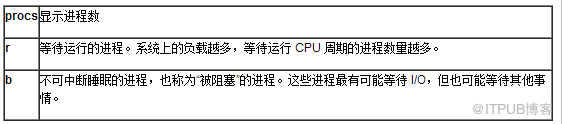
有时,还存在另外一列,该列位于标题“w”下,显示可以运行但已经交换到交换分区的进程数
"b"下的数值应该接近于0,如果"w"下的数值很高,可能需要运行更多的内存
下表显示了内存指标:
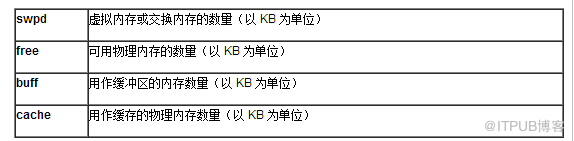
缓冲区内存(buff)用来存储文件元数据(如i-nodes)以及原始块设备中的数据
缓存内存(cache)用于文件数据本身
下表显示了交换活动

下表显示了I/O活动

下表显示了系统相关活动

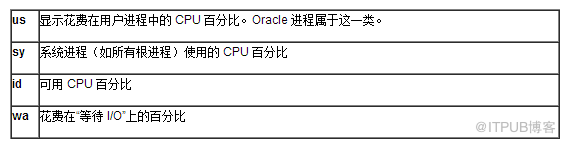
最后这张表可能用得最多---有关CPU负载的信息
让我们看一下如何解释这些值
输出的第一行是自从系统重新启动以来所有指标的平均值
因此,可忽略该行,因为它并不显示当前状态,其他行则显示实时指标
理想情况下,等待或阻塞的进程数量(位于"procs"标题下)应该为0或接近于0
如果数值较高,则表示系统没有足够的资源(如CPU 内存或I/O)
诊断性能问题时,该信息非常重要
"swap"下的数据表明交换是否过多,如果交换过多,则表明物理内存可能不足
应该减少内存需求或增加物理RAM
"io"下的数据表示往返于磁盘的数据流,这表明正在进行的磁盘活动量,这并不一定表明存在问题
如果您看到"procs"的"b"(正在阻塞的进程)下有较大的数值和较高的I/O,则可能出现严重的I/O争用问题
"cpu"标题下是最有用的信息,"id"列显示空闲CPU,如果用100减去该值,则会得到繁忙CPU的百分比
与top相比,top显示每个CPU的空闲百分比,而vmstat显示所有CPU的空闲百分比
vmstat命令还显示CPU的使用情况的划分:Linux系统使用多少,用户进程使用多少以及等待I/O使用多少
通过该划分,您可以确定CPU消耗的组成,如果系统CPU负载过高,能表明正在运行某个根进程吗?
一段时间内的系统负载应该一致,如果系统显示较高的值,请配合使用top命令确定占有CPU的系统进程
针对Oracle用户的用法
Oracle进程(后台进程和服务器进程)和用户进程(sqlplus,apache等)位于"us"下
如果该数值较高,则使用top来确定进程;如果"wa"列显示较高数值,则表明I/O系统无法跟上读取或写入的数量
有时这可能是因为在数据库中进行大量的更新,从而导致switch log以及后续的大量归档进程
但是,如果他持续显示一个较大的数值,则表明可能存在I/O瓶颈
Oracle数据库中的I/O瓶颈可能会造成严重的问题,与性能问题不同,慢速I/O可能导致控制文件写入速度缓慢
这会导致等待获取控制文件的进程加入队列,如果等待超过900秒且等待者是关键进程(如LGWR),则会关闭数据库实例
<!-- Baidu Button BEGIN -->
一个常见的问题是:
我的应用程序,服务器,用户以及系统进程等正在使用多少内存? 或者
现在多少内存可用?如果正在运行的进程使用的内存大于可用RAM,则需要将这些进程移到交换区
因此,一个补充的问题是:
正在使用多少交换区空间?
free命令将回答所有这些问题。而且,一个非常有用的选项-m可以显示可用内存(以MB为单位)
[root@Think ~]# free -m
             total       used       free     shared    buffers     cached
Mem:          1011        991         19          0         59        661
-/+ buffers/cache:        270        740
Swap:            0          0          0
以上输出显示系统具有1011MB的RAM,已使用991MB,还有19MB内存可用
第二行显示在物理内存中缓冲区和缓存大小的更改
第三行显示交换分区利用情况
要以KB或GB为单位显示以上内容,请将-m选项分别替换为-k或-g。使用-b选项将以字节为单位
[root@Think ~]# free -b
             total       used       free     shared    buffers     cached
Mem:    1060110336 1039556608   20553728          0   62877696  692731904
-/+ buffers/cache:  283947008  776163328
Swap:            0          0          0
-t选项在输出底部显示总数(物理内存和交换分区的总和):
[root@Think ~]# free -m -t
             total       used       free     shared    buffers     cached
Mem:          1011        991         19          0         60        660
-/+ buffers/cache:        270        740
Swap:            0          0          0
Total:        1011        991         19
尽管free不显示百分比,但是我们可以提取并格式化输出的特定部分
例如:已用内存占总数的百分比
[root@Think ~]# free -m | grep Mem | awk \'{print ($3 / $2)*100}\'
97.9228
这个值非常重要,您可能希望在可用内存的百分比低于特定阀值时触发一个警报
同样,要发现已使用交换分区空间的百分比,您可以:
[root@Think ~]# free -m | grep -i Swap | awk \'{print ($3 / $2)*100}\'可以使用free查看应用程序施加的内存负载
例如,启动备份应用程序之前检查可用内存,启动之后立即检查可用内存
两者之差就是备份应用程序消耗的内存
针对Oracle用户的用法
那么您如何使用该命令管理运行Oracle环境的Linux服务器呢?
性能问题的一个最常见原因是内存不足,从而导致系统临时将内存区域"交换"到磁盘中
某种程度的交换可能是必然的,但交换过多则表示可用内存不足
而现在,您可以使用free获得可用内存信息,紧接着使用sar命令(稍后介绍)检查内存和交换分区的消耗的历史趋势
如果交换分区的使用是暂时的,则可能出现一个高峰,但如果明确要经过一段时间,则应要注意
持续的内存过载可能有几个明显且可能的疑点:
● 较大的SGA高于可用内存
● 在PGA上分配了大量内存
● 某些进程出现泄漏内存的错误
对于第一种情况,应确保SGA低于可用内存,根据经验,对SGA使用大约是物理内存的40%,当然,应该根据具体情况定义该参数
对于第二种情况,应尝试减少查询中的大量缓冲区的分配
对于第三种情况,应使用ps命令确定可能泄露内存的具体进程
⑵ ipcs
当某个进程运行时,它会夺取"共享内存"
该进程可能拥有一个或很多个共享内存段
进程之间彼此发送消息并使用信号
要显示有关共享内存段,IPC消息队列以及信号的信息,可以使用一个命令:
ipcs
-m选项非常受欢迎,他能显示共享内存段
[root@Think ~]# ipcs -m

------ Shared Memory Segments --------
key        shmid      owner      perms      bytes      nattch     status
0x7402f3d8 4620288    root      600        4          0
0x00000000 4980737    root      644        52         2
0x7402f3d7 4587522    root      600        4          0
0x00000000 5013507    root      644        16384      2
0x00000000 5046276    root      644        268        2
0x00000000 5111813    root      600        393216     2          dest
0x00000000 5144582    root      600        393216     2          dest
0x00000000 5177351    root      600        393216     2          dest
0x00000000 5439503    root      600        393216     2          dest
0x00000000 5472272    root      600        393216     2          dest
0xbe3bb918 5505041    oracle    640        419438592  20
该输出表明服务器正在运行Oracle软件,显示了各种共享内存段
每个共享内存段由显示在"shmid"列下面的共享内存ID唯一标识(稍后,您将看到如何使用该值)
显然,"owner"显示内存段的所有者,"perms"列显示权限,"bytes"显示字节大小
-u选项显示一个非常快速的摘要
[root@Think ~]# ipcs -mu

------ Shared Memory Status --------
segments allocated 18
pages allocated 103562
pages resident  36482
pages swapped   0
Swap performance: 0 attempts     0 successes
-l显示限定值(相对于当前值):
[root@Think ~]# ipcs -ml

------ Shared Memory Limits --------
max number of segments = 4096
max seg size (kbytes) = 524288
max total shared memory (kbytes) = 8388608
min seg size (bytes) = 1
如果您看到当前值处于或接近限定值,则应该考虑提高限定值
可以使用shmid值获取具体共享内存段的详细快照,-i选项可以完成该操作
下面是查看shmid 5505041 详细信息的方法:
[root@Think ~]# ipcs -m -i 5505041

Shared memory Segment shmid=5505041
uid=501 gid=502 cuid=501        cgid=502
mode=0640       access_perms=0640
bytes=419438592 lpid=10881      cpid=5300       nattch=20
att_time=Sun Feb  3 20:58:28 2013
det_time=Sun Feb  3 20:58:28 2013
change_time=Sun Feb  3 09:08:06 2013
稍后,本文将采用一个案例向您介绍如何解释以上输出
-s显示系统中的信号:
[root@Think ~]# ipcs -s

------ Semaphore Arrays --------
key        semid      owner      perms      nsems
0x000000a7 0          root      600        1
0xf5d4b884 131073     oracle    640        154
他显示一些有价值的数据,显示ID为0的信号组具有1个信号,另一个信号组有154个信号
如果您增加信号,则总值必须低于内核参数(semmax)定义的上限
安装Oracle软件时,预安装的检查程序将检查semmax的设置
之后,当系统达到稳定状态时,您可以检查实际的利用情况,然后相应调整内核值
针对Oracle用户的用法
如何查看Oracle数据库实例使用的共享内存段?
为此,请使用oradebug命令
sys@ORCL> oradebug setmypid
Statement processed.
sys@ORCL> oradebug ipc
Information written to trace file.
sys@ORCL> oradebug TRACEFILE_NAME
/u01/app/oracle/admin/orcl/udump/orcl_ora_7525.trc
现在打开跟踪文件,将会看到共享内存ID(5505041)
下面是该文件的节选
 Area #0 `Fixed Size\' containing Subareas 0-0
  Total size 0000000000129cb0 Minimum Subarea size 00000000
   Area  Subarea    Shmid      Stable Addr      Actual Addr
      0        0  5505041 0x00000020000000 0x00000020000000
                              Subarea size     Segment size
                          000000000012a000 0000000019002000
 Area #1 `Variable Size\' containing Subareas 2-2
  Total size 0000000018c00000 Minimum Subarea size 00400000
   Area  Subarea    Shmid      Stable Addr      Actual Addr
      1        2  5505041 0x00000020400000 0x00000020400000
                              Subarea size     Segment size
                          0000000018c00000 0000000019002000
 Area #2 `Redo Buffers\' containing Subareas 1-1
  Total size 00000000002d6000 Minimum Subarea size 00000000
   Area  Subarea    Shmid      Stable Addr      Actual Addr
      2        1  5505041 0x0000002012a000 0x0000002012a000
                              Subarea size     Segment size
                          00000000002d6000 0000000019002000
可以使用共享内存ID来获取共享内存的详细信息
结合上面提到的ipcs -m -i 5505041
另一个有用的观察是lpid的值----最后一个接触共享内存段的进程的进程ID
要展示该属性值,使用SQL*PLUS从另一个会话连接到该实例
[oracle@Think ~]$ sqlplus / as sysdba

sys@ORCL> select spid from v$process where addr = (select paddr from v$session where sid = (select sid from v$mystat where rownum<2));

SPID
------------
11439
现在,针对同一个共享内存段再次执行ipcs命令
[root@Think ~]# ipcs -m -i 5505041

Shared memory Segment shmid=5505041
uid=501 gid=502 cuid=501        cgid=502
mode=0640       access_perms=0640
bytes=419438592 lpid=11476      cpid=5300       nattch=20
att_time=Sun Feb  3 21:25:31 2013
det_time=Sun Feb  3 21:25:31 2013
change_time=Sun Feb  3 09:08:06 2013
注意,lpid的值已经从原来的值10881更改为11476
lpid显示最后一个接触共享内存段的进程的PID
⑶ ipcrm
既然您已经标识了共享内存和其他IPC指标,那么使用它们做什么呢?
之前您看到过一些用法,如标识Oracle使用的共享内存,确保为共享内存设置了内核参数等等
另一个常见的应用是删除共享内存,IPC消息队列或信号组
要删除某个共享内存段,注意ipcs命令输出中它的shmid,然后使用-m选项删除该段,要删除ID为3735562段,使用:
[root@Think ~]# ipcrm -m 3735562
ipcrm: already removed id (3735562)
这将删除该共享内存,还可以使用该命令删除信号和IPC消息队列(使用-s和-q参数)
针对Oracle用户的用法
有时当您关闭数据库实例时,Linux内核可能未完全清除共享内存段
留下的共享内存没有什么用处,但是它会占用系统资源,从而使可用于其他进程的内存更少
这种情况下,可以检查oracle用户所拥有的任何延迟共享内存段,然后删除它们,如果有这样的段,使用ipcrm删之
⑷ vmstat
vmstat是最早用于显示所有与内存和进程相关信息的命令
调用时,该命令持续运行并发布其信息
它有两个参数:
vmstat
下面是当我们希望vmstat每隔5秒运行一次并在第10次运行后停止时的例子
每5秒之后都会输出一行并显示此时的统计信息
[root@Think ~]# vmstat 5 10
procs -----------memory---------- ---swap-- -----io---- --system-- -----cpu------
 r  b   swpd   free   buff  cache   si   so    bi    bo   in   cs us sy id wa st
 0  0      0  38576  76284 639688    0    0    25    24   98  186  1  1 97  1  0
 0  0      0  38532  76292 639716    0    0     0    22  102  194  0  0 99  0  0
 0  0      0  38516  76292 639720    0    0     0    13   99  187  0  0 99  0  0
 0  0      0  38524  76300 639720    0    0     0    68  121  232  1  0 99  0  0
 0  0      0  38524  76304 639720    0    0     0    16  165  298  1  1 99  0  0
 0  0      0  38540  76308 639720    0    0     0    16   84  176  0  0 99  0  0
 0  0      0  38524  76316 639840    0    0     0    81   94  187  0  0 99  0  0
 1  0      0  38404  76324 639848    0    0     0    17   89  181  0  0 100  0  0
 0  0      0  38404  76324 639848    0    0     0    13   93  180  0  0 99  0  0
 2  0      0  38420  76328 639848    0    0     0    11  220  364  1  1 99  0  0
该输出显示有关系统资源的大量信息,我们来详细介绍他们:
有时,还存在另外一列,该列位于标题“w”下,显示可以运行但已经交换到交换分区的进程数
"b"下的数值应该接近于0,如果"w"下的数值很高,可能需要运行更多的内存
下表显示了内存指标:
缓冲区内存(buff)用来存储文件元数据(如i-nodes)以及原始块设备中的数据
缓存内存(cache)用于文件数据本身
下表显示了交换活动
下表显示了I/O活动
下表显示了系统相关活动
最后这张表可能用得最多---有关CPU负载的信息
让我们看一下如何解释这些值
输出的第一行是自从系统重新启动以来所有指标的平均值
因此,可忽略该行,因为它并不显示当前状态,其他行则显示实时指标
理想情况下,等待或阻塞的进程数量(位于"procs"标题下)应该为0或接近于0
如果数值较高,则表示系统没有足够的资源(如CPU 内存或I/O)
诊断性能问题时,该信息非常重要
"swap"下的数据表明交换是否过多,如果交换过多,则表明物理内存可能不足
应该减少内存需求或增加物理RAM
"io"下的数据表示往返于磁盘的数据流,这表明正在进行的磁盘活动量,这并不一定表明存在问题
如果您看到"procs"的"b"(正在阻塞的进程)下有较大的数值和较高的I/O,则可能出现严重的I/O争用问题
"cpu"标题下是最有用的信息,"id"列显示空闲CPU,如果用100减去该值,则会得到繁忙CPU的百分比
与top相比,top显示每个CPU的空闲百分比,而vmstat显示所有CPU的空闲百分比
vmstat命令还显示CPU的使用情况的划分:Linux系统使用多少,用户进程使用多少以及等待I/O使用多少
通过该划分,您可以确定CPU消耗的组成,如果系统CPU负载过高,能表明正在运行某个根进程吗?
一段时间内的系统负载应该一致,如果系统显示较高的值,请配合使用top命令确定占有CPU的系统进程
针对Oracle用户的用法
Oracle进程(后台进程和服务器进程)和用户进程(sqlplus,apache等)位于"us"下
如果该数值较高,则使用top来确定进程;如果"wa"列显示较高数值,则表明I/O系统无法跟上读取或写入的数量
有时这可能是因为在数据库中进行大量的更新,从而导致switch log以及后续的大量归档进程
但是,如果他持续显示一个较大的数值,则表明可能存在I/O瓶颈
Oracle数据库中的I/O瓶颈可能会造成严重的问题,与性能问题不同,慢速I/O可能导致控制文件写入速度缓慢
这会导致等待获取控制文件的进程加入队列,如果等待超过900秒且等待者是关键进程(如LGWR),则会关闭数据库实例
来自 “ ITPUB博客 ” ,链接:https://blog.itpub.net/26515977/viewspace-1207986/ ,如需转载,请注明出处,否则将追究法律责任。

