We can get the concept of deadlock in wikipedia.
The picture below gives a common scenario which leads to deadlock.
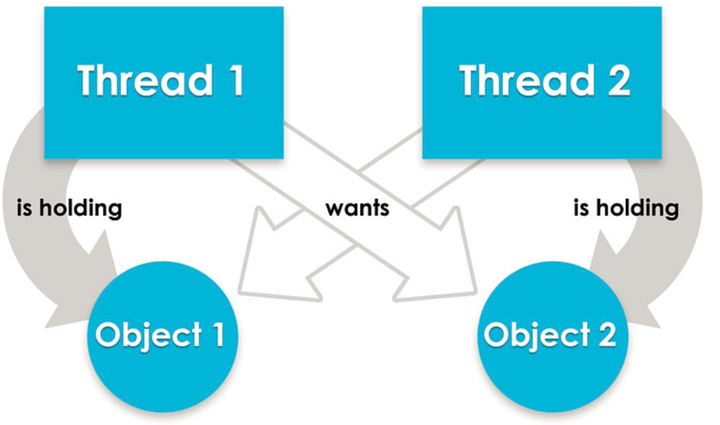
In this blog, I will share how to detect deadlock situation using JDK standard tool jstack. First we have to write a Java program which will lead to Deadlock:
package thread;public class DeadLockExample {/*  * Thread 1: locked resource 1    Thread 2: locked resource 2  */public static void main(String[] args) {
  final String resource1 = "ABAP";
  final String resource2 = "Java";
  // t1 tries to lock resource1 then resource2
  Thread t1 = new Thread() {
   public void run() {
    synchronized (resource1) {
     System.out.println("Thread 1: locked resource 1");
     try {
      Thread.sleep(100);
     } catch (Exception e) {
     }
     synchronized (resource2) {
      System.out.println("Thread 1: locked resource 2");
     }
    }
   }
  };
  Thread t2 = new Thread() {
   public void run() {
    synchronized (resource2) {
     System.out.println("Thread 2: locked resource 2");
     try {
      Thread.sleep(100);
     } catch (Exception e) {
     }
     synchronized (resource1) {
      System.out.println("Thread 2: locked resource 1");
     }
    }
   }
  };
  t1.start();
  t2.start();}}
Execute this program, you will get output: Thread 1: locked resource 1 Thread 2: locked resource 2 Then use command jps -l -m to list the process id of this deadlock program. In my example it is 51476:
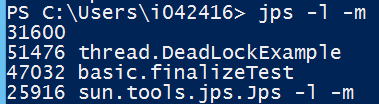
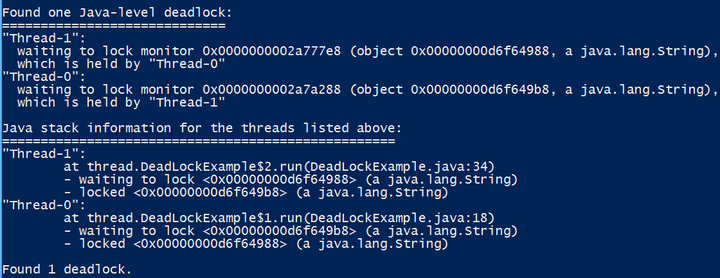
Just type jstack + process id, and it will display all detailed information about deadlock:
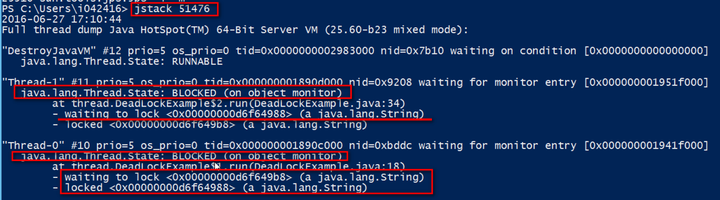
Here the object 0x00000000d6f64988 and 0x00000000d6f649b8represent the two resource String “ABAP” and “Java”.
Update on 2017-03-04 Saturday 10:35PM
how to get the thread state of a long-running application
Suppose you have found a long-running application which has high CPU utilization rate and you would like to know which exactly line is relevant. Use the following code to simulate the long running situation:
package thread;import java.util.ArrayList;import java.util.List;import java.util.concurrent.ExecutorService;import java.util.concurrent.Executors;class MyThread implements Runnable{
    private List<Integer> myList;
    private Object host;
    public MyThread(List<Integer> list, Object object){
        this.myList = list;
        this.host = object;
    }
    public void updateListSafe(){
        synchronized(this.host){
            ArrayList<Integer> safe = new ArrayList<Integer>();
            safe.add(1);
        }
    }
    private void updateList(int i){
        synchronized(this.host){
            myList.add(i);
        }
    }
    @Override
    public void run() {
        while(true){
            updateList(1);
        }
    }}public class MyExecutor {
    private ArrayList<Integer> taskList = new ArrayList<Integer>();
    private Object object = new Object();
    private void launch(){
        ExecutorService executorService= Executors.newFixedThreadPool(10);
        executorService.execute(new MyThread(taskList, object));
        executorService.execute(new MyThread(taskList, object));
    }
    public static void main(String[] args) {
        MyExecutor test = new MyExecutor();
        test.launch();
    }}
first find the process id of running application:

then use command jstack 23520 to get the stack trace:
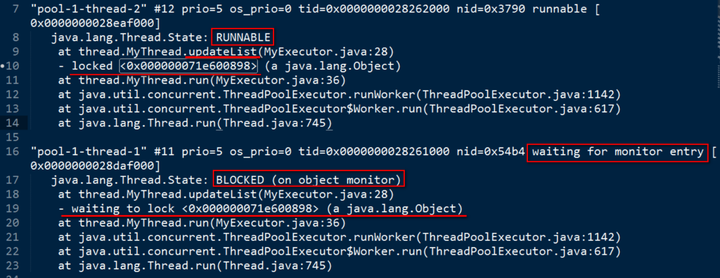
In line 9 and line 18 our application method MyThread.updateList is listed there.
要获取更多Jerry的原创文章,请关注公众号"汪子熙":

来自 “ ITPUB博客 ” ,链接:https://blog.itpub.net/24475491/viewspace-2713514/ ,如需转载,请注明出处,否则将追究法律责任。

