The OData service url being tested is: /sap/opu/odata/sap/CRM_ODATA/TaskCollection?$filter=isMyTask eq true&$expand=DocumentNotes,DocumentNextUserStatuses,DocumentHistories,DocumentApplicationLogs,Attachments
Approach1 – gateway client
Log on your gateway ( frontend ) server, use tcode /IWFND/GW_CLIENT, paste the url and execute. Then you will get execution time in unit Millisecond.

Approach2 – Chrome development tool
Open Chrome development tool via F12, paste the COMPLETE url with host name and port number and execute. The time will be displayed in column “Time”.

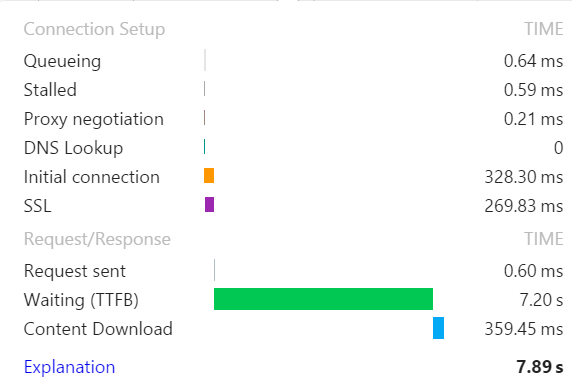
Hover the mouse to column “Timeline – Start Time”, and more detail explanation of elapsed time will be displayed as below:
Approach3 – Chrome extension Postman
You can also use Chrome extension – Postman Restclient to get a draft

Approach4 – Gateway performance trace /IWFND/TRACES
Launch the tcode and enable the performance trace by selecting the checkbox “Performance Trace”.
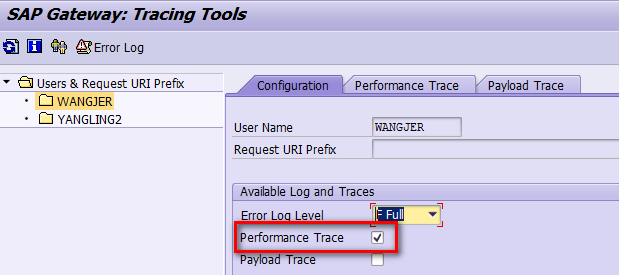
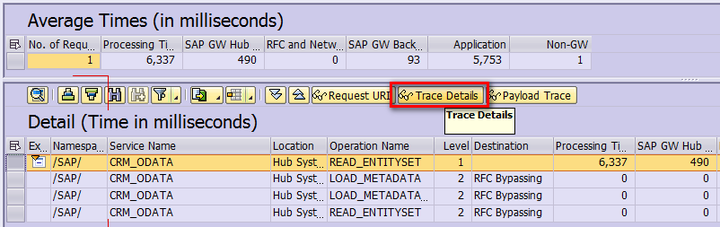
Then trigger a request via any of the above three approaches, and check your performance trace here:

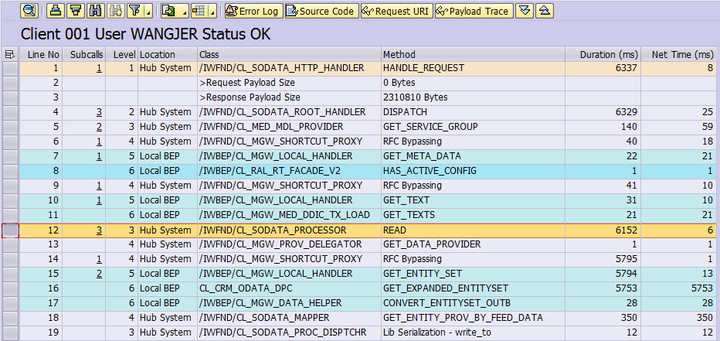
If you want a more detailed view, double click the entry, and then click “Trace Details”:
要获取更多Jerry的原创文章,请关注公众号"汪子熙":

来自 “ ITPUB博客 ” ,链接:https://blog.itpub.net/24475491/viewspace-2703098/ ,如需转载,请注明出处,否则将追究法律责任。

