select t.tenant_id, t.tenant_name, t.zone_list, t.primary_zone, t.locality, u.resource_pool_name, u.zone, u.svr_ipfrom gv$tenant t join gv$unit u on (t.tenant_id=u.tenant_id)where t.tenant_id=effective_tenant_id()order by t.tenant_id, u.zone, u.svr_ip;
create table bmsql_oorder (o_w_id integer not null,o_d_id integer not null,o_id integer not null,o_c_id integer,o_carrier_id integer,o_ol_cnt integer,o_all_local integer,o_entry_d timestamp,primary key (o_w_id, o_d_id, o_id)) partition by hash (o_w_id) partitions 12 ;
SELECT t5.tenant_name, t5.primary_zone tnt_primary_zone, t4.database_name, t4.primary_zone db_primary_zone, t3.tablegroup_name, t3.primary_zone tg_primary_zone, conv(t1.table_id,10,16) table_id, t1.primary_zone , t1.table_name, t2.partition_id, t2.role, t2.zone, concat(t2.svr_ip, ':', t2.svr_port) observer, round(t2.data_size / 1024 / 1024) data_size_mb, t2. row_countFROM gv$table t1 JOIN gv$partition t2 ON (t1.tenant_id = t2.tenant_id AND t1.table_id = t2.table_id)LEFT JOIN __all_virtual_tablegroup t3 ON (t1.tenant_id = t3.tenant_id AND t1.tablegroup_id = t3.tablegroup_id)JOIN gv$database t4 ON (t1.tenant_Id = t4.tenant_id AND t1.database_id = t4.database_id)JOIN gv$tenant t5 ON (t1.tenant_id = t5.tenant_id)WHERE t5.tenant_id = 1002 AND t2.role = 1 AND t4.database_name = 'TPCCDB' AND t1.table_name = 'bmsql_oorder'ORDER BY t5.tenant_name, t4.database_name, t3.tablegroup_name, t2.partition_id;
| primary_zone | table_name | partition_id | zone | observer |
select '0' as "partition id", o_w_id "warehouse id" , count(*) cnt from tpccdb.bmsql_oorder partition (p0) group by o_w_idunionselect '1' as "partition id", o_w_id "warehouse id" , count(*) cnt from tpccdb.bmsql_oorder partition (p1) group by o_w_idunionselect '2' as "partition id", o_w_id "warehouse id" , count(*) cnt from tpccdb.bmsql_oorder partition (p2) group by o_w_idunionselect '3' as "partition id", o_w_id "warehouse id" , count(*) cnt from tpccdb.bmsql_oorder partition (p3) group by o_w_idunionselect '4' as "partition id", o_w_id "warehouse id" , count(*) cnt from tpccdb.bmsql_oorder partition (p4) group by o_w_idunionselect '5' as "partition id", o_w_id "warehouse id" , count(*) cnt from tpccdb.bmsql_oorder partition (p5) group by o_w_idunionselect '6' as "partition id", o_w_id "warehouse id" , count(*) cnt from tpccdb.bmsql_oorder partition (p6) group by o_w_idunionselect '7' as "partition id", o_w_id "warehouse id" , count(*) cnt from tpccdb.bmsql_oorder partition (p7) group by o_w_idunionselect '8' as "partition id", o_w_id "warehouse id" , count(*) cnt from tpccdb.bmsql_oorder partition (p8) group by o_w_idunionselect '9' as "partition id", o_w_id "warehouse id" , count(*) cnt from tpccdb.bmsql_oorder partition (p9) group by o_w_idunionselect '10' as "partition id", o_w_id "warehouse id" , count(*) cnt from tpccdb.bmsql_oorder partition (p10) group by o_w_idunionselect '11' as "partition id", o_w_id "warehouse id" , count(*) cnt from tpccdb.bmsql_oorder partition (p11) group by o_w_idunionselect '12' as "partition id", o_w_id "warehouse id" , count(*) cnt from tpccdb.bmsql_oorder partition (p0) group by o_w_id;
查询结果如下:
| 1 |
| 2 |
| 3 |
| 4 |
| 5 |
| 6 |
| 7 |
| 9 |
select * from tpccdb.bmsql_oorderwhere o_w_id in (4,5,6) and o_d_id = 1 and o_id in (1,2)order by o_w_id ,o_d_id ,o_id ;
| 4 | 1 | 1 | 2,520 | 7 |
| 4 | 1 | 2 | 2,678 | 14 |
| 5 | 1 | 1 | 1,681 | 12 |
| 5 | 1 | 2 | 2 | 14 |
| 6 | 1 | 1 | 1 | 8 |
会话 1 更新记录不提交。
mysql> begin;select connection_id(); update bmsql_oorder set o_ol_cnt = o_ol_cnt+10, o_entry_d = now() where o_w_id = 4 and o_d_id = 1 and o_id = 1 ;Query OK, 0 rows affected (0.00 sec)+-----------------+| connection_id() |+-----------------+| 3221870232 |+-----------------+1 row in set (0.00 sec)Query OK, 1 row affected (0.10 sec)Rows matched: 1 Changed: 1 Warnings: 0
会话 2 更新另外一笔记录不提交。
mysql> begin;select connection_id(); update bmsql_oorder set o_ol_cnt = o_ol_cnt+10, o_entry_d = now() where o_w_id = 5 and o_d_id = 1 and o_id = 1 ;Query OK, 0 rows affected (0.03 sec)+-----------------+| connection_id() |+-----------------+| 3221742394 |+-----------------+1 row in set (0.01 sec)Query OK, 1 row affected (0.30 sec)Rows matched: 1 Changed: 1 Warnings: 0
会话 1 更新被会话2 锁住的记录。
update bmsql_oorder set o_ol_cnt = o_ol_cnt+10, o_entry_d = now() where o_w_id = 5 and o_d_id = 1 and o_id = 1 ;会话 2 也更新会话 1 锁住的记录。
update bmsql_oorder set o_ol_cnt = o_ol_cnt+10, o_entry_d = now() where o_w_id = 4 and o_d_id = 1 and o_id = 1 ;语句超时报错
mysql> update bmsql_oorder set o_ol_cnt = o_ol_cnt+10, o_entry_d = now() where o_w_id = 4 and o_d_id = 1 and o_id = 1 ;ERROR 1205 (HY000): Lock wait timeout exceeded; try restarting transactionmysql> show global variables where variable_name in ('ob_query_timeout','ob_trx_idle_timeout','ob_trx_lock_timeout','ob_trx_timeout');+---------------------+------------+| Variable_name | Value |+---------------------+------------+| ob_query_timeout | 10000000 || ob_trx_idle_timeout | 1000000000 || ob_trx_lock_timeout | -1 || ob_trx_timeout | 1000000000 |+---------------------+------------+4 rows in set (0.01 sec)
后咨询 OB 技术,了解到是没有在 OCP 里开启“死锁检测”。
+ 前提条件- 当前登录账号具备集群的管理权限。- 当前集群版本为 V3.2.0 及以上,且集群非只读集群。- 集群未开启死锁自动检测功能。+ 操作步骤1. 登录 OCP 。默认进入 **集群** 页面。2. 在 **集群** 页面的 **集群列表** 区域,选择待操作的集群并单击其集群名。3. 单击 **总览** 页面右上角的 **...** 图标,在菜单栏中单击 **开启死锁自动检测** 。4. 在对话框中单击 **确定** ,即可开启死锁自动检测功能。
开启死锁自动检测后,OceanBase 会自动发现死锁,并对死锁进行回滚,同时可保存近 7 天的死锁记录。
注意: 开启死锁需要消耗 2% 左右的性能,请谨慎操作。
按照提示操作后。果然这次能检测到死锁了。

文档对于原理没有多说,应该是开启了什么参数。通过 OB 的事件日志表 `__all_rootservice_event_history` 找到了相应的线索。
select gmt_create , module, event, name1, value1, name2, value2,name3, value3from `__all_rootservice_event_history` ewhere module in ('root_service') and event='admin_set_config'order by gmt_create desc limit 5;
| root_service | admin_set_config | ret | 0 | arg | {items:[{name:"_lcl_op_interval", value:"0ms", comment:"", zone:"", server:"0.0.0.0", tenant_name:"", exec_tenant_id:1, tenant_ids:[]}], is_inner:false} |
查看隐含参数值。
alter system set `_lcl_op_interval` = '25ms';select gmt_modified , svr_type, svr_ip , name, data_type , value ,`section` ,`scope` ,edit_levelfrom `__all_sys_parameter` p where p.name='_lcl_op_interval' ;
开启死锁检测后,可以通过内部表 `__all_virtual_deadlock_event_history` 查看相关信息。
select tenant_id, event_id, svr_ip, detector_id, usec_to_time(report_time) report_time, cycle_idx, cycle_size, role, priority, usec_to_time(create_time) create_time, start_delay,visitor, resource, extra_name1,extra_value1from __all_virtual_deadlock_event_historyorder by create_time desc limit 10;

分布式数据库死锁检测是个难点,官网关于“死锁检测”的原理说明:[OceanBase 主动死锁检测](https://www.oceanbase.com/docs/enterprise-oceanbase-database-cn-10000000000946538) ,这里不深入讨论。
这里需要注意,跟传统数据不一样的地方是,OB 检测到死锁后只是中断了发生死锁的语句,并不会回滚整个事务。另外一个事务依然处于阻塞/等待状态,直到语句超时。所以,需要应用能捕获数据库异常,在异常处理里及时回滚事务。
目前这个死锁还属于单个节点内部的死锁,更大的挑战是跨多个节点的死锁检测,即分布式死锁检测。
更换两笔记录 (`o_w_id` 为 5 和 6)的更新。
会话 1 更新并锁住一笔记录。
set session ob_query_timeout=800000000;begin;select now(),connection_id(); update bmsql_oorder set o_ol_cnt = o_ol_cnt+10, o_entry_d = now() where o_w_id = 5 and o_d_id = 1 and o_id = 1 ;
会话 2 更新并锁住另外一笔记录。
set session ob_query_timeout=800000000;begin;select now(),connection_id(); update bmsql_oorder set o_ol_cnt = o_ol_cnt+10, o_entry_d = now() where o_w_id = 6 and o_d_id = 1 and o_id = 1 ;
会话 1 继续更新会话 2 锁住的记录。
update bmsql_oorder set o_ol_cnt = o_ol_cnt+10, o_entry_d = now() where o_w_id = 6 and o_d_id = 1 and o_id = 1 ;
此时发生阻塞。
会话 2 继续
update bmsql_oorder set o_ol_cnt = o_ol_cnt+10, o_entry_d = now() where o_w_id = 5 and o_d_id = 1 and o_id = 1 ;ERROR 1213 (HY000): Deadlock
会话 2 报错,发生死锁。
此时,会话 1 依然是阻塞等待状态,直到会话 2 提交或者回滚事务,或者会话 1 语句超时或者事务超时。
死锁内部表数据:

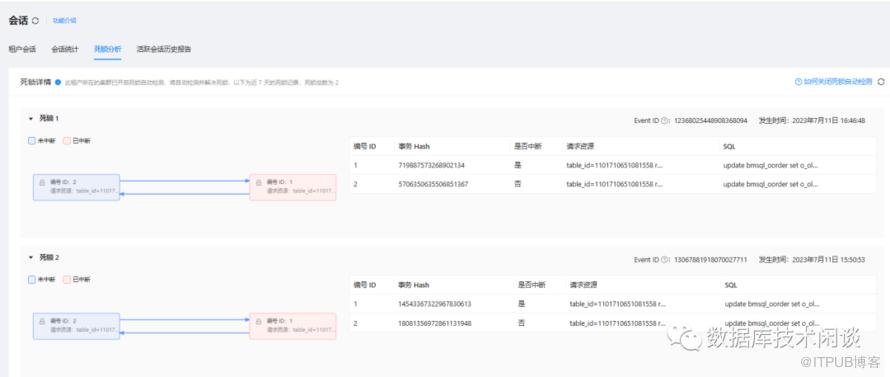
再查看 OCP 中的死锁检测报告。

不同之处在于,OCP 指出了其中一个请求的资源是`remote row` ,说明这是一个分布式死锁。
[OceanBase 企业版3.2 正式发布](https://ask.oceanbase.com/t/topic/13700131) [OceanBase 死锁检测](https://www.oceanbase.com/docs/enterprise-oceanbase-database-cn-10000000000945520) [从ORACLE/MySQL到OceanBase:数据库超时机制](https://mp.weixin.qq.com/s/zQcuvFbyhsPjSS2s6_2F1w) [国际顶会 ICDE入选 | OceanBase 死锁检测实现了哪些技术突破?- 知乎](https://zhuanlan.zhihu.com/p/624847601)
原文作者:数据库技术闲谈;如有侵权,请联系管理员删除。

