5.7.22,此处以表的统计信息为例进行描述
一、 information_schema.tables
表的信息大部分的信息来自Innodb数据字典dict_table_t内存信息。
  TABLE_CATALOG: def                   0
   TABLE_SCHEMA: test                  1
     TABLE_NAME: tt3_1383              2
     TABLE_TYPE: BASE TABLE            3
         ENGINE: InnoDB                4
        VERSION: 10                    5
     ROW_FORMAT: Dynamic               6
     TABLE_ROWS: 0                     7
 AVG_ROW_LENGTH: 0                     8
    DATA_LENGTH: 16384                 9
MAX_DATA_LENGTH: 0                    10
   INDEX_LENGTH: 0                    11
      DATA_FREE: 0                    12
 AUTO_INCREMENT: NULL                 13
    CREATE_TIME: 2021-05-07 05:50:17  14
    UPDATE_TIME: NULL                 15
     CHECK_TIME: NULL                 16
TABLE_COLLATION: latin1_swedish_ci    17
       CHECKSUM: NULL                 18
 CREATE_OPTIONS:                      19
  TABLE_COMMENT:                      20


  {"TABLES", tables_fields_info, create_schema_table,
   get_all_tables, make_old_format, get_schema_tables_record, 1, 2, 0,
   OPTIMIZE_I_S_TABLE}
文件sql_show.cc中还包含很多我们知道的information_schema下字典的信息来源information_schema.tables而获取函数为get_schema_tables_record,每行都会调用这个函数,其中大部分数据来自于file->stats,file就是handler而stats是handler下的一个类如下:
  ulonglong data_file_length;  /* Length off data file */
  ulonglong max_data_file_length; /* Length off data file */
  ulonglong index_file_length;
  ulonglong max_index_file_length;
  ulonglong delete_length;  /* Free bytes */
  ulonglong auto_increment_value;
  /*
    The number of records in the table.
      0    - means the table has exactly 0 rows
    other  - if (table_flags() & HA_STATS_RECORDS_IS_EXACT)
               the value is the exact number of records in the table
             else
               it is an estimate
  */
  ha_rows records;
  ha_rows deleted;   /* Deleted records */
  ulong mean_rec_length;  /* physical reclength */
  time_t create_time;   /* When table was created */
  ulong check_time;
  ulong update_time;
  uint block_size;   /* index block size */

  /*
    number of buffer bytes that native mrr implementation needs,
  */
  uint mrr_length_per_rec;

  /**
    Estimate for how much of the table that is availabe in a memory
    buffer. Valid range is [0..1]. If it has the special value
    IN_MEMORY_ESTIMATE_UNKNOWN (defined in structs.h), it means that
    the storage engine has not supplied any value for it.
  */
  double table_in_mem_estimate;
那么为了对接这些统计值,那么Innodb必然要在合适的位置的对他们进行实现。实际上每次访问表的时候都会陷入Innodb层,通过函数ha_innobase::info_low去填充,就像其注释写的一样
/* Collect table info from the storage engine */
当然这个函数并不简单的填充,还会做一些判断,比如innobase_stats_on_metadata开启情况下判断是否需要现场收集统计信息,此时事务的状态为updating table statistics。因此当我们并不需要全部表的时候,应该加上where条件进行判断,减少get_schema_tables_record和ha_innobase::info_low调用的次数,否则表多的话可能需要一定的时间(同时也包含show table status本质上和访问表一致)。调用栈:
#0  ha_innobase::info_low (this=0x7fff9693da00, flag=212, is_analyze=false) at /opt/percona-server-locks-detail-5.7.22/storage/innobase/handler/ha_innodb.cc:14921
#1  0x0000000001987734 in ha_innobase::info (this=0x7fff9693da00, flag=212) at /opt/percona-server-locks-detail-5.7.22/storage/innobase/handler/ha_innodb.cc:15354
#2  0x00000000015dbdc9 in get_schema_tables_record (thd=0x7fff94000b70, tables=0x7fff96fef818, table=0x7fff95b595f0, res=false, db_name=0x7fff940109e8, table_name=0x7fff94010da0)
    at /opt/percona-server-locks-detail-5.7.22/sql/sql_show.cc:5681
#3  0x00000000015d86c7 in fill_schema_table_by_open (thd=0x7fff94000b70, mem_root=0x7fffdac33b30, is_show_fields_or_keys=false, table=0x7fff95b595f0,
    schema_table=0x2cea0a0 <schema_tables+1856>, orig_db_name=0x7fff940109e8, orig_table_name=0x7fff94010da0, open_tables_state_backup=0x7fffdac33b90, can_deadlock=false)
    at /opt/percona-server-locks-detail-5.7.22/sql/sql_show.cc:4359
#4  0x00000000015daa36 in get_all_tables (thd=0x7fff94000b70, tables=0x7fff94006850, cond=0x0) at /opt/percona-server-locks-detail-5.7.22/sql/sql_show.cc:5352
#5  0x00000000015e8ef1 in do_fill_table (thd=0x7fff94000b70, table_list=0x7fff94006850, qep_tab=0x7fff94010870) at /opt/percona-server-locks-detail-5.7.22/sql/sql_show.cc:8791
在函数ha_innobase::info_low可以发现很多统计信息实际上来自dict_table_t中的成员元素,包含:
stat_n_rows(records TABLE_ROWS) 行的记录 stat_clustered_index_size(data_file_length DATA_LENGTH) 聚集索引大小 stat_sum_of_other_index_sizes(index_file_length INDEX_LENGTH) 其他索引大小 update_time(update_time UPDATE_TIME) 最后修改时间 autoinc(auto_increment_value AUTO_INCREMENT) 自增值
其他值可以进行推算
data_file_length(DATA_LENGTH)来自 stat_clustered_index_size * page_size.physical index_file_length(INDEX_LENGTH)来自 stat_sum_of_other_index_sizes * page_size.physical mean_rec_length(AVG_ROW_LENGTH)来自 data_file_length/records;
下面这个信息则来自文件的建立的时间 create_time来自函数os_file_get_status,其中通过stat获取了文件的建立时间 当然其他信息可以自行查看函数。不做过多解释。我们通常叫它transient统计数据
二、mysql.innodb_table_stats
这个表是Innodb表,是事先的存储好的,我们可以稍微看一下他的信息来源函数dict_stats_save。这个函数会在dict_stats_update收集完persistent然后进行插入。
 pars_info_add_str_literal(pinfo, "database_name", db_utf8);
 pars_info_add_str_literal(pinfo, "table_name", table_utf8);
 pars_info_add_int4_literal(pinfo, "last_update", now); //注意这里是统计数据收集时间
 pars_info_add_ull_literal(pinfo, "n_rows", table->stat_n_rows);
 pars_info_add_ull_literal(pinfo, "clustered_index_size",
  table->stat_clustered_index_size);
 pars_info_add_ull_literal(pinfo, "sum_of_other_index_sizes",
  table->stat_sum_of_other_index_sizes);

 ret = dict_stats_exec_sql(
  pinfo,
  "PROCEDURE TABLE_STATS_SAVE () IS\n"
  "BEGIN\n"

  "DELETE FROM \"" TABLE_STATS_NAME "\"\n"
  "WHERE\n"
  "database_name = :database_name AND\n"
  "table_name = :table_name;\n"

  "INSERT INTO \"" TABLE_STATS_NAME "\"\n"
  "VALUES\n"
  "(\n"
  ":database_name,\n"
  ":table_name,\n"
  ":last_update,\n"
  ":n_rows,\n"
  ":clustered_index_size,\n"
  ":sum_of_other_index_sizes\n"
  ");\n"
  "END;", NULL);

宏:TABLE_STATS_NAME
#define TABLE_STATS_NAME "mysql/innodb_table_stats"
我们可以看到这里的信息实际就是将数据插入进去,因此访问本表只是简单的Innodb数据读取。这点和information_schema.tables完全不同。但是我们这里看到information_schema.tables的TABLE_ROWS和n_rows来自同一值dict_table_t.stat_n_rows,而这里包含了统计数据最后收集的时间,我们在代码中也能看到取的当前时间now。我们通常叫它persistent统计数据。
三、统计数据收集
总的统计数据收集接口为dict_stats_update,这里面我们看到并不是说参数innodb_stats_persistent设置为ON就不收集transient统计数据,而是如下:
ON:persistent统计数据和transient统计数据都进行收集 OFF: 只收集transient统计数据
具体的收集方法就是将dict_table_t字典结构中关于统计数据的数据进行更新,然后通过上面我们说获取的方式,将信息获取出来即可。当然收集统计数据可能是由统一的线程进行的参考:https://www.jianshu.com/p/019378bfd51f
下面我们来测试一下:1、 innodb_stats_persistent设置为ON
2、 innodb_stats_persistent设置为OFF,并且插入数据后查看统计数据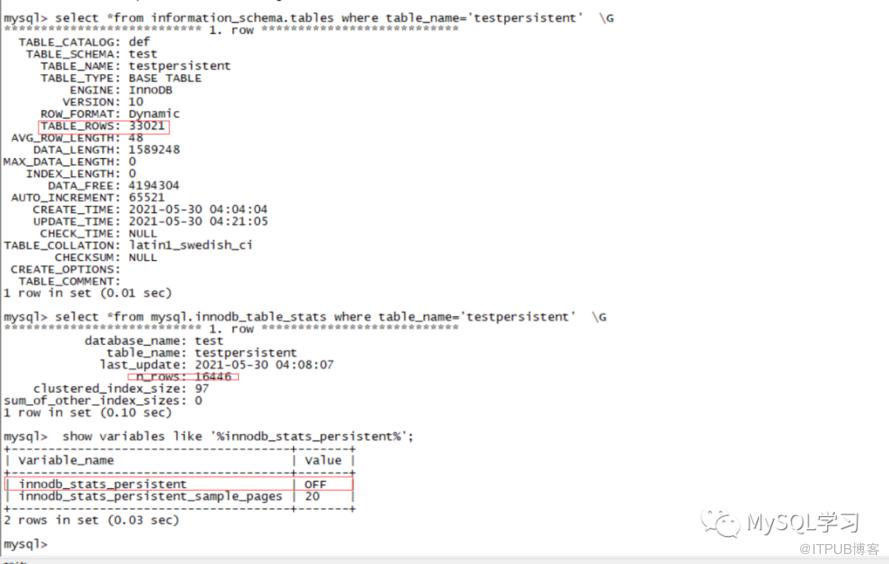
3、使用analyze手动触发分析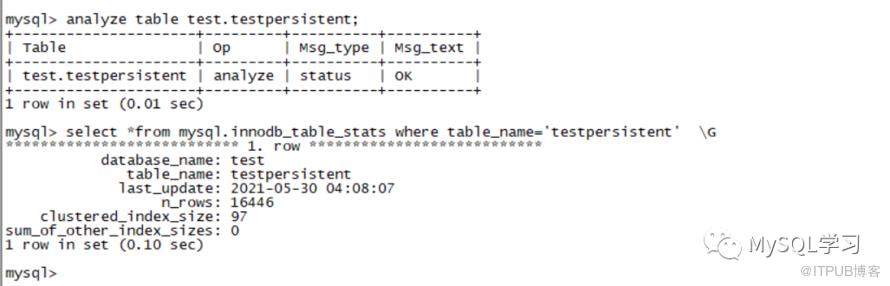
4、修改参数 innodb_stats_persistent设置为ON,手动分析
其他函数备忘:
ha_innobase::info_low fill_schema_index_stats get_schema_tables_record dict_stats_update_transient dict_stats_save 使用 btr_estimate_n_rows_in_range_low ->dict_table_get_n_rows /** Estimates the number of rows in a given index range.*/
原文作者:MySQL学习;如有侵权,请联系管理员删除。

