
阿里妹导读
目前go语言不仅在阿里集团内部,在整个互联网行业内也越来越流行,本文把高德过去go服务开发中的性能调优经验进行总结和沉淀,希望能为正在使用go语言的同学在性能优化方面带来一些参考价值。
前言
从理论的角度,和你一起捋清性能优化的思路,制定合适的优化方案。 推荐几款go语言性能分析利器,与你一起在性能优化的路上披荆斩棘。 总结归纳了众多go语言中常用的性能优化小技巧,总有一个你能用上。 基于高德go服务百万级QPS实践,分享几个性能优化实战案例,让性能优化不再是纸上谈兵。
一、性能调优-理论篇
1.1 衡量指标
cpu:对于偏计算型的应用,cpu往往是影响性能好坏的关键,如果代码中存在无限循环,或是频繁的线程上下文切换,亦或是糟糕的垃圾回收策略,都将导致cpu被大量占用,使得应用程序无法获取到足够的cpu资源,从而响应缓慢,性能变差。 内存:内存的读写速度非常快,往往不是性能的瓶颈,但是内存相对来说容量有限切价格昂贵,如果应用大量分配内存而不及时回收,就会造成内存溢出或泄漏,应用无法分配新的内存,便无法正常运行,这将导致很严重的事故。 带宽:对于偏网络I/O型的应用,例如网关服务,带宽的大小也决定了应用的性能好坏,如果带宽太小,当系统遇到大量并发请求时,带宽不够用,网络延迟就会变高,这个虽然对服务端可能无感知,但是对客户端则是影响甚大。 磁盘:相对内存来说,磁盘价格低廉,容量很大,但是读写速度较慢,如果应用频繁的进行磁盘I/O,那性能可想而知也不会太好。
以上这些都是系统资源层面用于衡量性能的指标,除此之外还有应用本身的稳定性指标:
异常率:也叫错误率,一般分两种,执行超时和应用panic。panic会导致应用不可用,虽然服务通常都会配置相应的重启机制,确保偶然的应用挂掉后能重启再次提供服务,但是经常性的panic,会导致应用频繁的重启,减少了应用正常提供服务的时间,整体性能也就变差了。异常率是非常重要的指标,服务的稳定和可用是一切的前提,如果服务都不可用了,还谈何性能优化。 响应时间(RT):包括平均响应时间,百分位(top percentile)响应时间。响应时间是指应用从收到请求到返回结果后的耗时,反应的是应用处理请求的快慢。通常平均响应时间无法反应服务的整体响应情况,响应慢的请求会被响应快的请求平均掉,而响应慢的请求往往会给用户带来糟糕的体验,即所谓的长尾请求,所以我们需要百分位响应时间,例如tp99响应时间,即99%的请求都会在这个时间内返回。 吞吐量:主要指应用在一定时间内处理请求/事务的数量,反应的是应用的负载能力。我们当然希望在应用稳定的情况下,能承接的流量越大越好,主要指标包括QPS(每秒处理请求数)和QPM(每分钟处理请求数)。
1.2 制定优化方案
-
优化代码
1)提高复用性,将通用的代码抽象出来,减少重复开发。
2)池化,对象可以池化,减少内存分配;协程可以池化,避免无限制创建协程打满内存。
3)并行化,在合理创建协程数量的前提下,把互不依赖的部分并行处理,减少整体的耗时。
4)异步化,把不需要关心实时结果的请求,用异步的方式处理,不用一直等待结果返回。
5)算法优化,使用时间复杂度更低的算法。
-
使用设计模式
-
空间换时间或时间换空间
-
使用更好的三方库
从上面可以看出zap的性能比同类结构化日志包更好,也比标准库更快,那我们就可以选择更好的三方库。
二、性能调优-工具篇
2.1 benchmark
package main
import (    "fmt"    "strconv"    "testing")
func BenchmarkStrconv(b *testing.B) {    for n := ; n < b.N; n++ {      strconv.Itoa(n)  }}
func BenchmarkFmtSprint(b *testing.B) {    for n := ; n < b.N; n++ {      fmt.Sprint(n)  }}
我们可以用命令行go test -bench . 来运行基准测试,输出结果如下:
goos: darwingoarch: amd64pkg: maincpu: Intel(R) Core(TM) i7-9750H CPU @ 2.60GHz 41988014 27.41 ns/op 13738172 81.19 ns/opok main 7.039s
goos: darwingoarch: amd64pkg: maincpu: Intel(R) Core(TM) i7-9750H CPU @ 2.60GHz 211533207 31.60 ns/op 69481287 89.58 ns/opPASSok main 18.891s
goos: darwingoarch: amd64pkg: maincpu: Intel(R) Core(TM) i7-9750H CPU @ 2.60GHz 217894554 31.76 ns/op 217140132 31.45 ns/op 219136828 31.79 ns/op 70683580 89.53 ns/op 63881758 82.51 ns/op 64984329 82.04 ns/opPASSok main 54.296s结果变化也不大,看来strconv是真的比fmt.Sprint快很多。那快是快,会不会内存分配上情况就相反呢?
goos: darwingoarch: amd64pkg: maincpu: Intel(R) Core(TM) i7-9750H CPU @ 2.60GHz 43700922 27.46 ns/op 7 B/op 0 allocs/op 143412 80.88 ns/op 16 B/op 2 allocs/opPASSok main 7.031s可以看到strconv在内存分配上是0次,每次运行使用的内存是7字节,只是fmt.Sprint的43.8%,简直是全方面的优于fmt.Sprint啊。那究竟是为什么strconv比fmt.Sprint好这么多呢?
const digits = "0123456789abcdefghijklmnopqrstuvwxyz"const smallsString = "00010203040506070809" + "10111213141516171819" + "20212223242526272829" + "30313233343536373839" + "40414243444546474849" + "50515253545556575859" + "60616263646566676869" + "70717273747576777879" + "80818283848586878889" + "90919293949596979899"// small returns the string for an i with 0 <= i < nSmalls.func small(i int) string { if i < 10 { return digits[i : i+1] } return smallsString[i*2 : i*2+2]}func formatBits(dst []byte, u uint64, base int, neg, append_ bool) (d []byte, s string) { ... for j := 4; j > ; j-- { is := us % 100 * 2 us /= 100 i -= 2 a[i+1] = smallsString[is+1] a[i+] = smallsString[is+] } ...}
而fmt.Sprint则是通过反射来实现这一目的的,fmt.Sprint得先判断入参的类型,在知道参数是int型后,再调用fmt.fmtInteger方法把int转换成string,这多出来的步骤肯定没有直接把int转成string来的高效。
// fmtInteger formats signed and unsigned integers.func (f *fmt) fmtInteger(u uint64, base int, isSigned bool, verb rune, digits string) { ... switch base { case 10: for u >= 10 { i-- next := u / 10 buf[i] = byte('0' + u - next*10) u = next } ...}
benchmark还有很多实用的函数,比如ResetTimer可以重置启动时耗费的准备时间,StopTimer和StartTimer则可以暂停和启动计时,让测试结果更集中在核心逻辑上。
2.2 pprof
2.2.1 使用介绍
runtime/pprof 通过在代码中显式的增加触发和结束埋点来收集指定代码块运行时数据生成性能报告。 net/http/pprof 是对runtime/pprof的二次封装,基于web服务运行,通过访问链接触发,采集服务运行时的数据生成性能报告。
package main
import (  "os"  "runtime/pprof"  "time")
func main() {  w, _ := os.OpenFile("test_cpu", os.O_RDWR | os.O_CREATE | os.O_APPEND, 0644)  pprof.StartCPUProfile(w)  time.Sleep(time.Second)  pprof.StopCPUProfile()}
我们也可以使用另外一种方法,net/http/pprof:
package main
import (    "net/http"    _ "net/http/pprof")
func main() {    err := http.ListenAndServe(":6060", nil)    if err != nil {        panic(err)    }}
将程序run起来后,我们通过访问http://127.0.0.1:6060/debug/pprof/就可以看到如下页面:
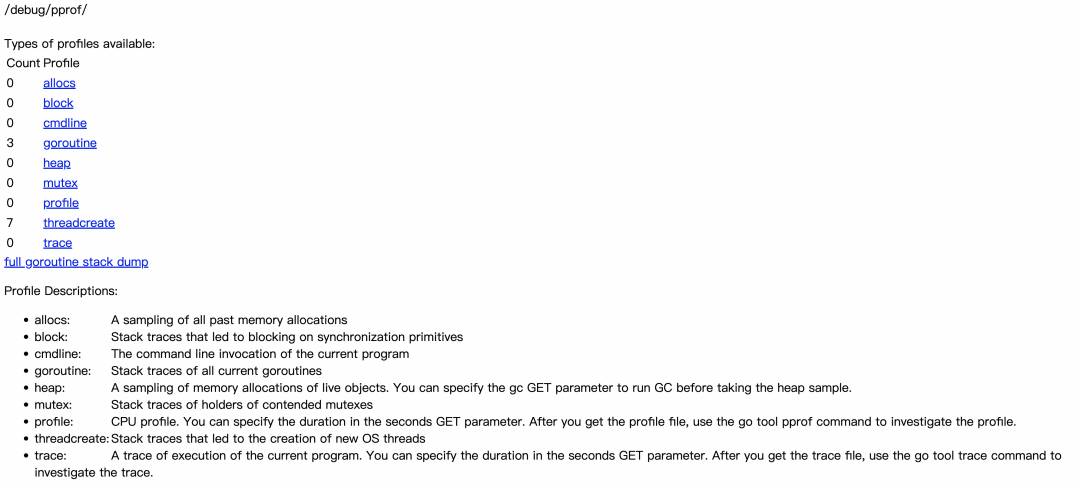
pprof支持两种查看模式,终端和web界面,注意: 想要查看可视化界面需要提前安装graphviz。
go tool pprof -http :6060 test_cpu

2.2.1 火焰图 Flame Graph如何阅读

2.2.2 dot Graph 图如何阅读
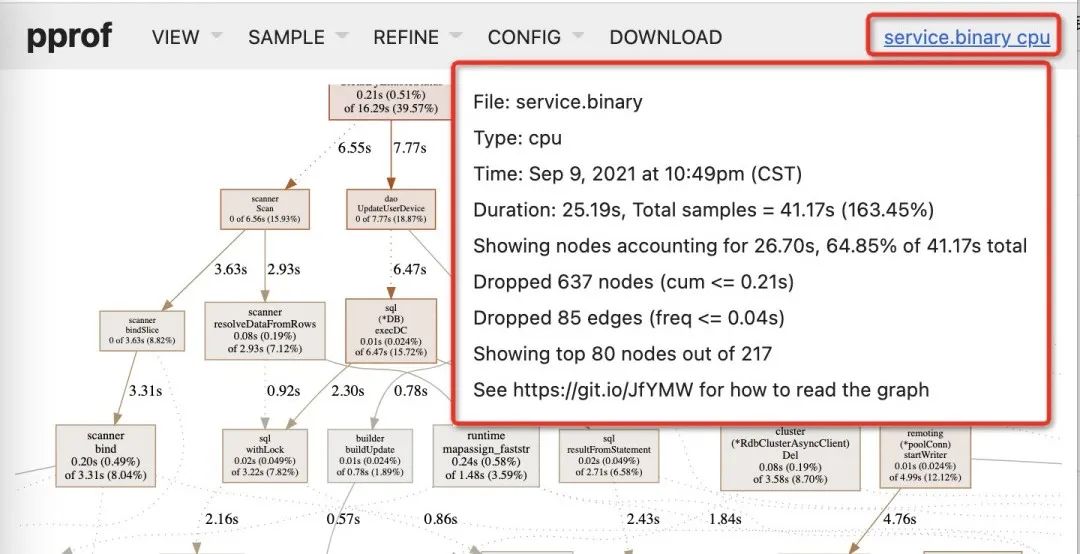
节点颜色:
红色表示耗时多的节点; 绿色表示耗时少的节点; 灰色表示耗时几乎可以忽略不计(接近零);
节点字体大小 :
字体越大,表示占“上层函数调用”比例越大;(其实上层函数自身也有耗时,没包含在此) 字体越小,表示占“上层函数调用”比例越小;
线条(边)粗细:
线条越粗,表示消耗了更多的资源; 反之,则越少;
线条(边)颜色:
颜色越红,表示性能消耗占比越高; 颜色越绿,表示性能消耗占比越低; 灰色,表示性能消耗几乎可以忽略不计;
虚线:表示中间有一些节点被“移除”或者忽略了;(一般是因为耗时较少所以忽略了) 实线:表示节点之间直接调用 -
内联边标记:被调用函数已经被内联到调用函数中 (对于一些代码行比较少的函数,编译器倾向于将它们在编译期展开从而消除函数调用,这种行为就是内联。)
2.2.3 TOP 表如何阅读
flat:当前函数,运行耗时(不包含内部调用其他函数的耗时) flat%:当前函数,占用的 CPU 运行耗时总比例(不包含外部调用函数) -
sum%:当前行的 flat% 与上面所有行的 flat% 总和。 cum:当前函数加上它内部的调用的运行总耗时(包含内部调用其他函数的耗时) cum%:同上的 CPU 运行耗时总比例

2.3 trace
与goroutine调度有关的事件信息:goroutine的创建、启动和结束;goroutine在同步原语(包括mutex、channel收发操作)上的阻塞与解锁。 与网络有关的事件:goroutine在网络I/O上的阻塞和解锁; 与系统调用有关的事件:goroutine进入系统调用与从系统调用返回; 与垃圾回收器有关的事件:GC的开始/停止,并发标记、清扫的开始/停止。
并行执行程度不足的问题:比如没有充分利用多核资源等; 因GC导致的延迟较大的问题; Goroutine执行情况分析,尝试发现goroutine因各种阻塞(锁竞争、系统调用、调度、辅助GC)而导致的有效运行时间较短或延迟的问题。
2.3.1 trace性能报告

View trace:以图形页面的形式渲染和展示tracer的数据,这也是我们为关注/常用的功能 Goroutine analysis:以表的形式记录执行同一个函数的多个goroutine的各项trace数据 Network blocking profile:用pprof profile形式的调用关系图展示网络I/O阻塞的情况 Synchronization blocking profile:用pprof profile形式的调用关系图展示同步阻塞耗时情况 Syscall blocking profile:用pprof profile形式的调用关系图展示系统调用阻塞耗时情况 Scheduler latency profile:用pprof profile形式的调用关系图展示调度器延迟情况 User-defined tasks和User-defined regions:用户自定义trace的task和region Minimum mutator utilization:分析GC对应用延迟和吞吐影响情况的曲线图
2.3.2 view trace
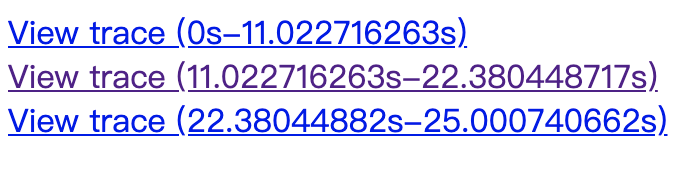
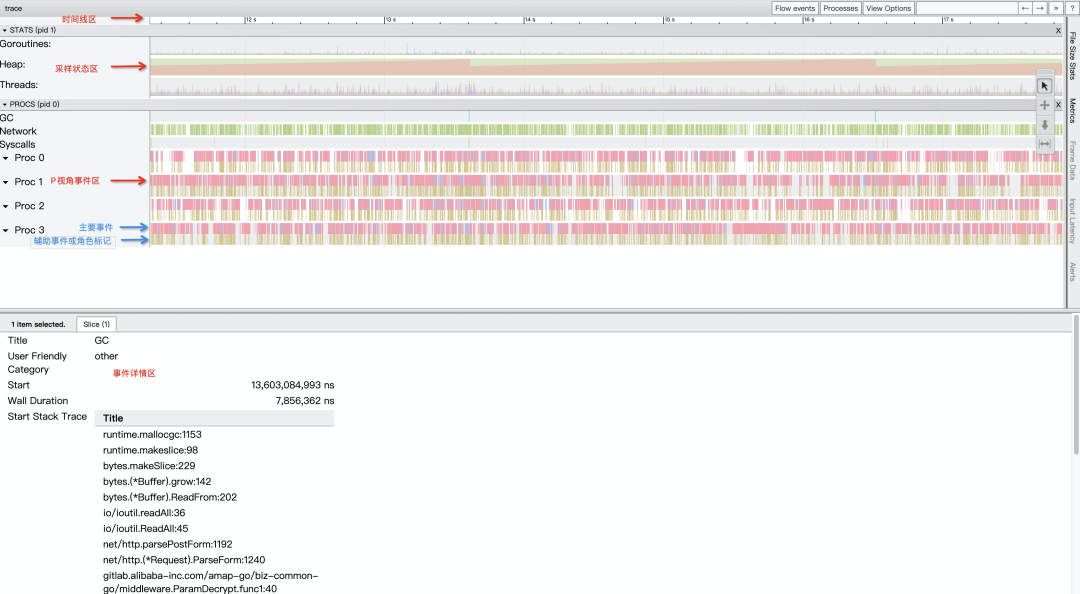
采样状态




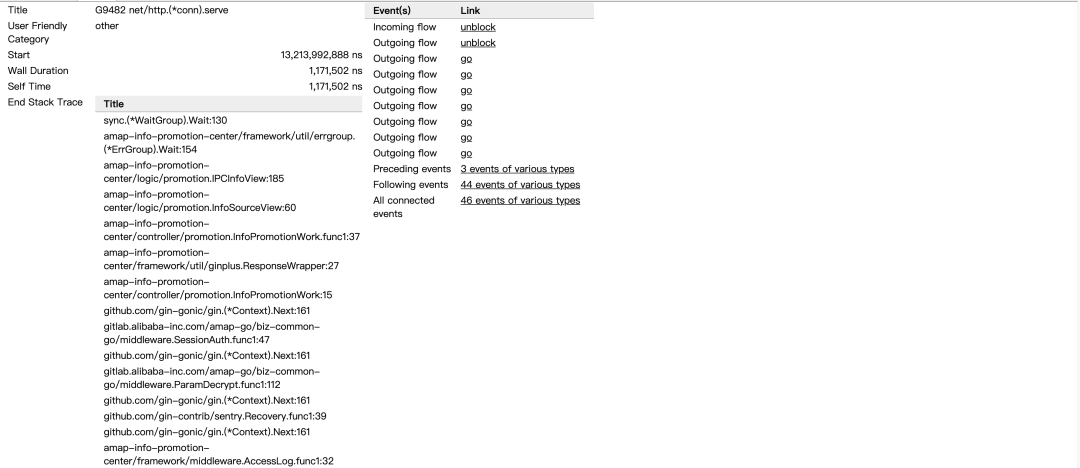
Title:事件的可读名称; Start:事件的开始时间,相对于时间线上的起始时间; Wall Duration:这个事件的持续时间,这里表示的是G1在P4上此次持续执行的时间; Start Stack Trace:当P4开始执行G1时G1的调用栈; End Stack Trace:当P4结束执行G1时G1的调用栈;从上面End Stack Trace栈顶的函数为runtime.asyncPreempt来看,该Goroutine G1是被强行抢占了,这样P4才结束了其运行; Incoming flow:触发P4执行G1的事件; Outgoing flow:触发G1结束在P4上执行的事件; Preceding events:与G1这个goroutine相关的之前的所有的事件; Follwing events:与G1这个goroutine相关的之后的所有的事件 All connected:与G1这个goroutine相关的所有事件。
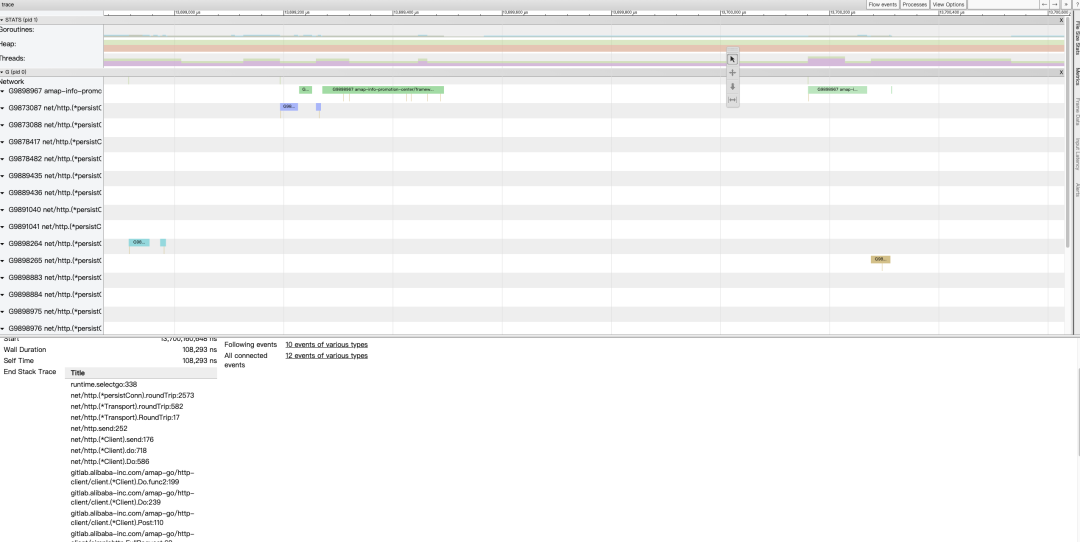
2.3.3 Goroutine analysis
2.4 后记
获取性能报告麻烦:一般大家做压测,为了更接近真实环境性能态,都使用生产环境/pre环境进行。而出于安全考虑,生产环境内网一般和PC办公内网是隔离不通的,需要单独配置通路才可以获得生产环境内网的profile 文件下载到PC办公电脑中,这也有一些额外的成本; -
查看profile分析报告麻烦:之前大家在本地查看profile 分析报告,一般 go tool pprof -http=":8083" profile 命令在本地PC开启一个web service 查看,并且需要至少安装graphviz 等库。 -
查看trace分析同样麻烦:查看go trace 的profile 信息来分析routine 锁和生命周期时,也需要类似的方式在本地PC执行命令 go tool trace mytrace.profile 。 分享麻烦:如果我想把自己压测的性能结果内容,分享个另一位同学,那只能把1中获取的性能报告“profile文件”通过钉钉发给被分享人。然而有时候本地profile文件比较多,一不小心就发错了,还不如截图,但是截图又没有了交互放大、缩小、下钻等能力。处处不给力! 留存复盘麻烦:系统的性能分析就像一份病历,每每看到阶段性的压测报告,总结或者对照时,不禁要询问,做过了哪些优化和改造,病因病灶是什么,有没有共性,值不值得总结归纳,现在是不是又面临相似的性能问题?
三、性能调优-技巧篇
3.1 字符串拼接
// 推荐:用+进行字符串拼接func BenchmarkPlus(b *testing.B) {  for i := ; i < b.N; i++ {    s := "a" + "b"    _ = s  }}// 不推荐:用fmt.Sprintf进行字符串拼接func BenchmarkFmt(b *testing.B) {  for i := ; i < b.N; i++ {    s := fmt.Sprintf("%s%s", "a", "b")    _ = s  }}
goos: darwingoarch: amd64pkg: maincpu: Intel(R) Core(TM) i7-9750H CPU @ 2.60GHzBenchmarkPlus-12        1000000000               0.2658 ns/op           B/op           allocs/opBenchmarkFmt-12         16559949                70.83 ns/op            2 B/op          1 allocs/opPASSok      main  5.908s
// 推荐:初始化时指定容量func BenchmarkGenerateWithCap(b *testing.B) {
  nums := make([]int, , 10000)  for n := ; n < b.N; n++ {    for i:=; i < 10000; i++ {      nums = append(nums, i)    }  }}// 不推荐:初始化时不指定容量func BenchmarkGenerate(b *testing.B) {  nums := make([]int, )  for n := ; n < b.N; n++ {    for i:=; i < 10000; i++ {      nums = append(nums, i)    }  }}
goos: darwingoarch: amd64pkg: maincpu: Intel(R) Core(TM) i7-9750H CPU @ 2.60GHzBenchmarkGenerateWithCap-12        23508            336485 ns/op          476667 B/op           allocs/opBenchmarkGenerate-12               22620             68747 ns/op          426141 B/op           allocs/opPASSok      main  16.628s
3.3 遍历 []struct{} 使用下标而不是 range
func getIntSlice() []int {  nums := make([]int, 1024, 1024)  for i := ; i < 1024; i++ {    nums[i] = i  }  return nums}// 用下标遍历[]intfunc BenchmarkIndexIntSlice(b *testing.B) {  nums := getIntSlice()  b.ResetTimer()  for i := ; i < b.N; i++ {    var tmp int    for k := ; k < len(nums); k++ {      tmp = nums[k]    }    _ = tmp  }}// 用range遍历[]int元素func BenchmarkRangeIntSlice(b *testing.B) {  nums := getIntSlice()  b.ResetTimer()  for i := ; i < b.N; i++ {    var tmp int    for _, num := range nums {      tmp = num    }    _ = tmp  }}
goos: darwingoarch: amd64pkg: demo/testcpu: Intel(R) Core(TM) i7-9750H CPU @ 2.60GHzBenchmarkIndexIntSlice-12        3923230               270.2 ns/op              B/op           allocs/opBenchmarkRangeIntSlice-12        4518495               287.8 ns/op              B/op           allocs/opPASSok      demo/test       3.303s
可以看到,在遍历[]int时,两种方式并无差别。
type Item struct {  id  int  val [1024]byte}// 推荐:用下标遍历[]struct{}func BenchmarkIndexStructSlice(b *testing.B) {  var items [1024]Item  for i := ; i < b.N; i++ {    var tmp int    for j := ; j < len(items); j++ {      tmp = items[j].id    }    _ = tmp  }}// 推荐:用range的下标遍历[]struct{}func BenchmarkRangeIndexStructSlice(b *testing.B) {  var items [1024]Item  for i := ; i < b.N; i++ {    var tmp int    for k := range items {      tmp = items[k].id    }    _ = tmp  }}// 不推荐:用range遍历[]struct{}的元素func BenchmarkRangeStructSlice(b *testing.B) {  var items [1024]Item  for i := ; i < b.N; i++ {    var tmp int    for _, item := range items {      tmp = item.id    }    _ = tmp  }}
goos: darwingoarch: amd64pkg: demo/testcpu: Intel(R) Core(TM) i7-9750H CPU @ 2.60GHzBenchmarkIndexStructSlice-12             4413182               266.7 ns/op              B/op           allocs/opBenchmarkRangeIndexStructSlice-12        4545476               269.4 ns/op              B/op           allocs/opBenchmarkRangeStructSlice-12               33300             35444 ns/op                B/op           allocs/opPASSok      demo/test       5.282s
可以看到,用for循环下标的方式性能都差不多,但是用range遍历数组里的元素时,性能则相差很多,前面两种方法是第三种方法的130多倍。主要原因是通过for k, v := range获取到的元素v实际上是原始值的一个拷贝。所以在面对复杂的struct进行遍历的时候,推荐使用下标。但是当遍历对象是复杂结构体的指针([]*struct{})时,用下标还是用range迭代元素的性能就差不多了。
3.4 利用unsafe包避开内存copy

func Str2bytes(s string) []byte {   x := (*[2]uintptr)(unsafe.Pointer(&s))   h := [3]uintptr{x[], x[1], x[1]}   return *(*[]byte)(unsafe.Pointer(&h))}
func Bytes2str(b []byte) string {   return *(*string)(unsafe.Pointer(&b))}
我们通过benchmark来验证一下是否性能更优:
// 推荐:用unsafe.Pointer实现string到bytesfunc BenchmarkStr2bytes(b *testing.B) {  s := "testString"  var bs []byte  for n := ; n < b.N; n++ {    bs = Str2bytes(s)  }  _ = bs}// 不推荐:用类型转换实现string到bytesfunc BenchmarkStr2bytes2(b *testing.B) {  s := "testString"  var bs []byte  for n := ; n < b.N; n++ {    bs = []byte(s)  }  _ = bs}// 推荐:用unsafe.Pointer实现bytes到stringfunc BenchmarkBytes2str(b *testing.B) {  bs := Str2bytes("testString")  var s string  b.ResetTimer()  for n := ; n < b.N; n++ {    s = Bytes2str(bs)  }  _ = s}// 不推荐:用类型转换实现bytes到stringfunc BenchmarkBytes2str2(b *testing.B) {  bs := Str2bytes("testString")  var s string  b.ResetTimer()  for n := ; n < b.N; n++ {    s = string(bs)  }  _ = s}
goos: darwingoarch: amd64pkg: demo/testcpu: Intel(R) Core(TM) i7-9750H CPU @ 2.60GHzBenchmarkStr2bytes-12           1000000000               0.2938 ns/op           B/op           allocs/opBenchmarkStr2bytes2-12          38193139                28.39 ns/op           16 B/op          1 allocs/opBenchmarkBytes2str-12           1000000000               0.2552 ns/op           B/op           allocs/opBenchmarkBytes2str2-12          60836140                19.60 ns/op           16 B/op          1 allocs/opPASSok      demo/test       3.301s
可以看到使用unsafe.Pointer比强制类型转换性能是要高不少的,从内存分配上也可以看到完全没有新的内存被分配。
3.5 协程池
var wg sync.WaitGroupch := make(chan struct{}, 3)for i := ; i < 10; i++ { ch <- struct{}{} wg.Add(1) go func(i int) { defer wg.Done() log.Println(i) time.Sleep(time.Second) <-ch }(i)}wg.Wait()
这里通过限制channel长度为3,可以实现多只有3个协程被创建的效果。
func Test_ErrGroupRun(t *testing.T) { errgroup := WithTimeout(nil, 10*time.Second) errgroup.SetMaxProcs(4) for index := ; index < 10; index++ { errgroup.Run(nil, index, "test", func(context *gin.Context, i interface{}) (interface{}, error) { t.Logf("[%s]input:%+v, time:%s", "test", i, time.Now().Format("2006-01-02 15:04:05")) time.Sleep(2*time.Second) return i, nil }) } errgroup.Wait()}
输出结果如下:
=== RUN Test_ErrGroupRun errgroup_test.go:23: [test]input:, time:2022-12-04 17:31:29 errgroup_test.go:23: [test]input:3, time:2022-12-04 17:31:29 errgroup_test.go:23: [test]input:1, time:2022-12-04 17:31:29 errgroup_test.go:23: [test]input:2, time:2022-12-04 17:31:29 errgroup_test.go:23: [test]input:4, time:2022-12-04 17:31:31 errgroup_test.go:23: [test]input:5, time:2022-12-04 17:31:31 errgroup_test.go:23: [test]input:6, time:2022-12-04 17:31:31 errgroup_test.go:23: [test]input:7, time:2022-12-04 17:31:31 errgroup_test.go:23: [test]input:8, time:2022-12-04 17:31:33 errgroup_test.go:23: [test]input:9, time:2022-12-04 17:31:33--- PASS: Test_ErrGroupRun (6.00s)PASS
errgroup可以通过SetMaxProcs设定协程池的大小,从上面的结果可以看到,多就4个协程在运行。
3.6 sync.Pool 对象复用
type ActTask struct {  Id                 int64                `ddb:"id"`             // 主键id  Status             common.Status        `ddb:"status"`         // 状态 0=初始 1=生效 2=失效 3=过期  BizProd            common.BizProd       `ddb:"biz_prod"`       // 业务类型  Name               string               `ddb:"name"`            // 活动名  Adcode             string               `ddb:"adcode"`         // 城市  RealTimeRuleByte   []byte               `ddb:"realtime_rule"`  // 实时规则json  ...}
type RealTimeRuleStruct struct {  Filter []*struct {    PropertyId   int64    `json:"property_id"`    PropertyCode string   `json:"property_code"`    Operator     string   `json:"operator"`    Value        []string `json:"value"`  } `json:"filter"`  ExtData [1024]byte `json:"ext_data"`}
func (at *ActTask) RealTimeRule() *form.RealTimeRule {  if err := json.Unmarshal(at.RealTimeRuleByte, &at.RealTimeRuleStruct); err != nil {    return nil  }  return at.RealTimeRuleStruct}
以这里的实时投放规则为例,我们会将过滤规则反序列化为字节数组。每次json.Unmarshal都会申请一个临时的结构体对象,而这些对象都是分配在堆上的,会给 GC 造成很大压力,严重影响程序的性能。
var realTimeRulePool = sync.Pool{ New: func() interface{} { return new(RealTimeRuleStruct) },}
然后调用 Pool 的 Get() 和 Put() 方法来获取和放回池子中。
rule := realTimeRulePool.Get().(*RealTimeRuleStruct)json.Unmarshal(buf, rule)realTimeRulePool.Put(rule)
Get() 用于从对象池中获取对象,因为返回值是 interface{},因此需要类型转换。 Put() 则是在对象使用完毕后,放回到对象池。
var realTimeRule = []byte("{\\\"filter\\\":[{\\\"property_id\\\":2,\\\"property_code\\\":\\\"search_poiid_industry\\\",\\\"operator\\\":\\\"in\\\",\\\"value\\\":[\\\"yimei\\\"]},{\\\"property_id\\\":4,\\\"property_code\\\":\\\"request_page_id\\\",\\\"operator\\\":\\\"in\\\",\\\"value\\\":[\\\"all\\\"]}],\\\"white_list\\\":[{\\\"property_id\\\":1,\\\"property_code\\\":\\\"white_list_for_adiu\\\",\\\"operator\\\":\\\"in\\\",\\\"value\\\":[\\\"j838ef77bf227chcl89888f3fb0946\\\",\\\"lb89bea9af558589i55559764bc83e\\\"]}],\\\"ipc_user_tag\\\":[{\\\"property_id\\\":1,\\\"property_code\\\":\\\"ipc_crowd_tag\\\",\\\"operator\\\":\\\"in\\\",\\\"value\\\":[\\\"test_20227041152_mix_ipc_tag\\\"]}],\\\"relation_id\\\":0,\\\"is_copy\\\":true}")// 推荐:复用一个对象,不用每次都生成新的func BenchmarkUnmarshalWithPool(b *testing.B) {  for n := ; n < b.N; n++ {    task := realTimeRulePool.Get().(*RealTimeRuleStruct)    json.Unmarshal(realTimeRule, task)    realTimeRulePool.Put(task)  }}// 不推荐:每次都会生成一个新的临时对象func BenchmarkUnmarshal(b *testing.B) {  for n := ; n < b.N; n++ {    task := &RealTimeRuleStruct{}    json.Unmarshal(realTimeRule, task)  }}
goos: darwingoarch: amd64pkg: demo/testcpu: Intel(R) Core(TM) i7-9750H CPU @ 2.60GHzBenchmarkUnmarshalWithPool-12    3627546     319.4 ns/op   312 B/op  7 allocs/opBenchmarkUnmarshal-12            2342208     490.8 ns/op  1464 B/op  8 allocs/opPASSok      demo/test       3.525s
可以看到,两种方法在时间消耗上差不太多,但是在内存分配上差距明显,使用sync.Pool后内存占用仅为不使用的1/5。
3.7 避免系统调用
// 推荐:不使用系统调用func BenchmarkNoSytemcall(b *testing.B) { b.RunParallel(func(pb *testing.PB) { for pb.Next() { if configs.PUBLIC_KEY != nil { } } })}// 不推荐:使用系统调用func BenchmarkSytemcall(b *testing.B) { b.RunParallel(func(pb *testing.PB) { for pb.Next() { if os.Getenv("PUBLIC_KEY") != "" { } } })}goos: darwingoarch: amd64pkg: demo/testcpu: Intel(R) Core(TM) i7-9750H CPU @ 2.60GHzBenchmarkNoSytemcall-12 1000000000 0.1495 ns/op B/op allocs/opBenchmarkSytemcall-12 37224988 31.10 ns/op B/op allocs/opPASSok demo/test 1.877s
四、性能调优-实战篇
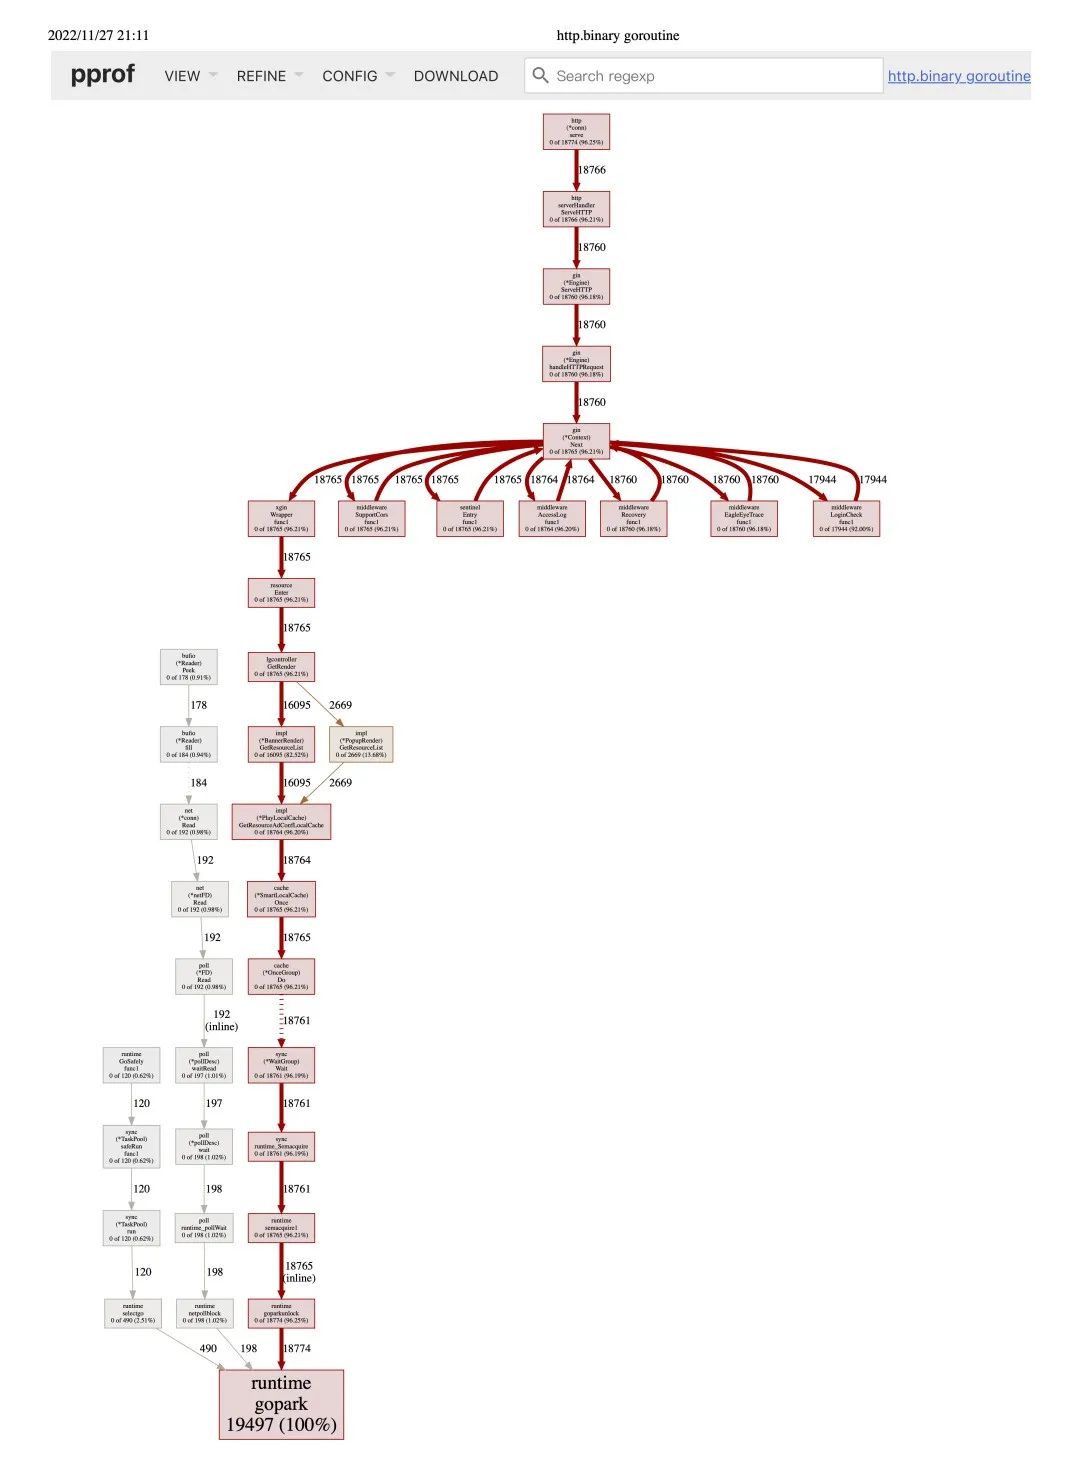
案例1: go协程创建数据库连接不释放导致内存暴涨

案例2: 优惠索引内存分配大,gc 耗时高


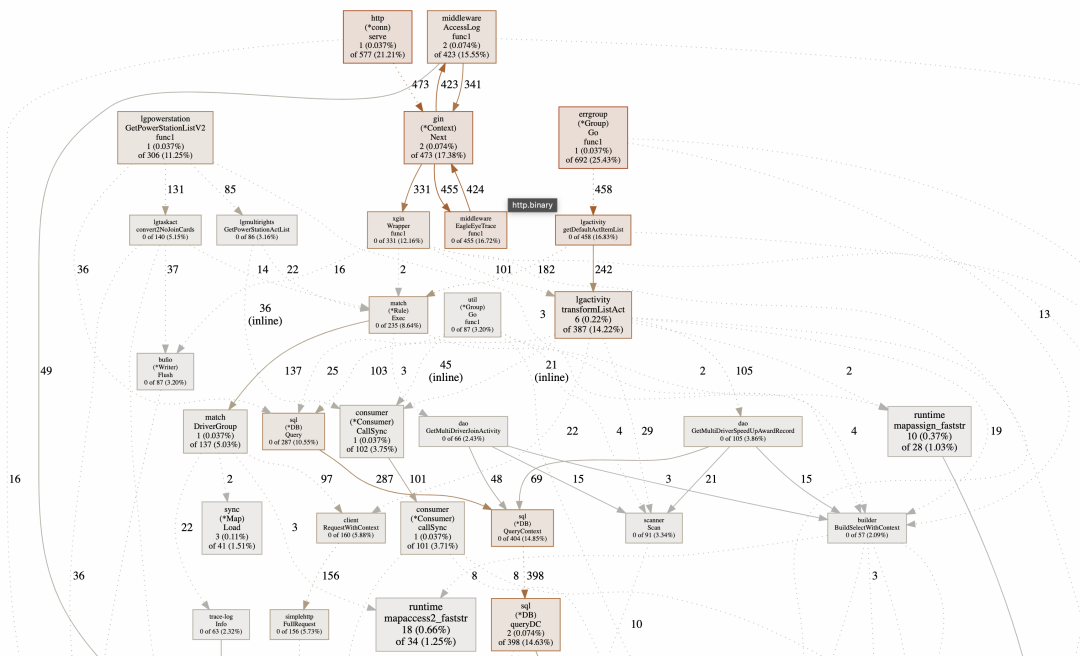
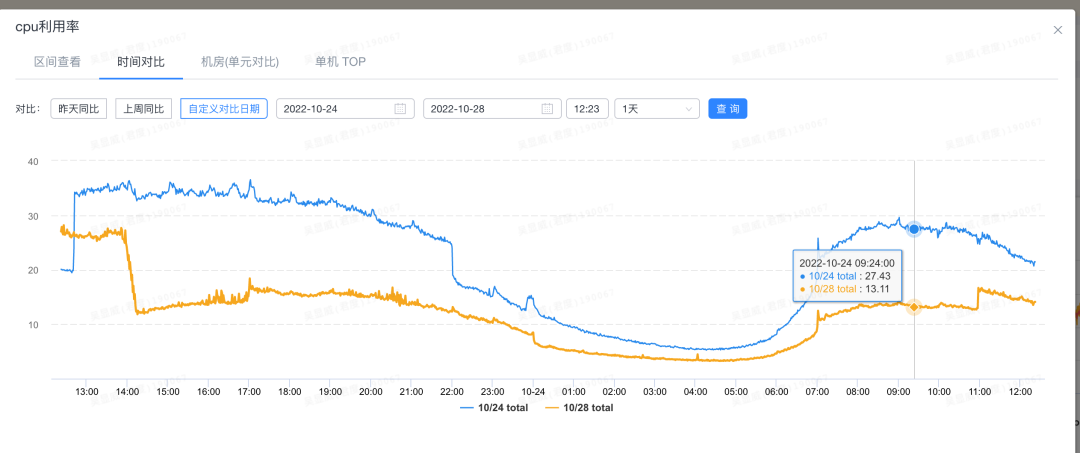
案例3:流量上涨导致cpu异常飙升

1、优化toEntity方法,简化为单独的ID()方法
2、优化数组、map初始化结构
3、优化adCode转换为string过程
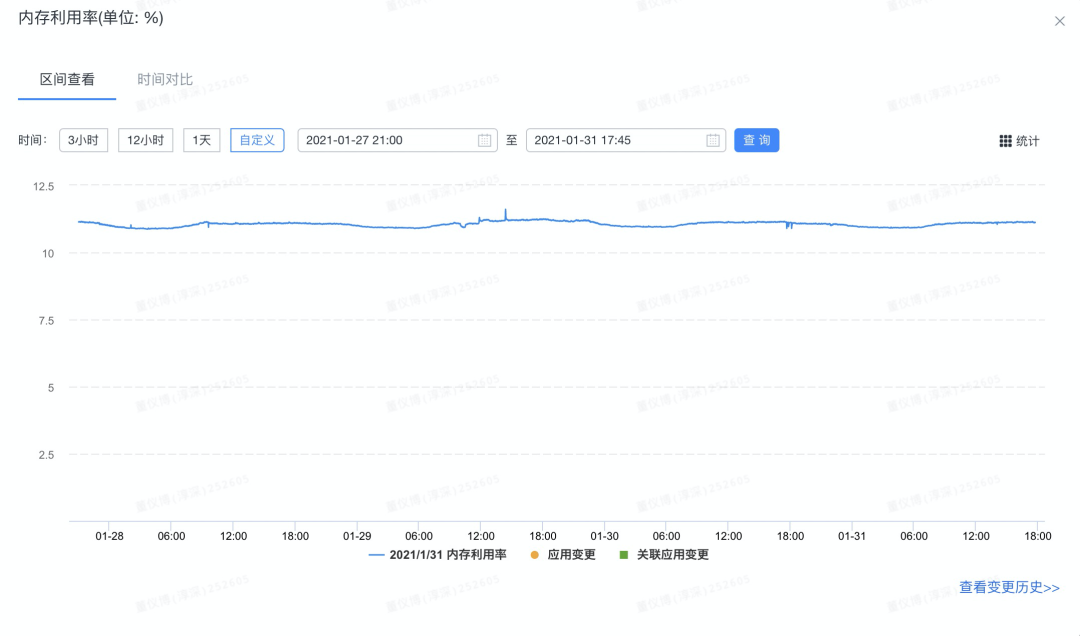
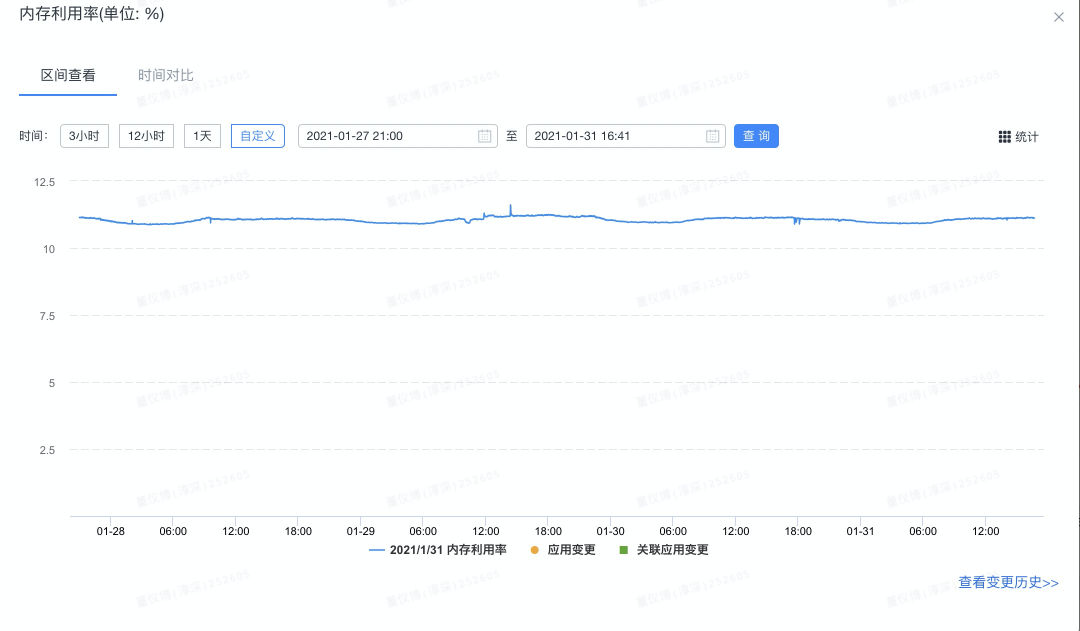
案例4:内存对象未释放导致内存泄漏



结语
来自 “ ITPUB博客 ” ,链接:https://blog.itpub.net/758/viewspace-3141542/ ,如需转载,请注明出处,否则将追究法律责任。

