背景
项目DDD重构后,所有依赖重新整理,试运行期间发现链路追踪的抓取信息不够丰富,就翻下原来的项目源码,再看下对应的改造下。
环境依赖
kafka
elasticsearch 7.10.0 (jdk11)
Kibana 7.10
zipkin server
sleuth
随着微服务的应用,我们运维系统时面临以下问题
真实情况的请求链路是什么?
链路请求过程中每个耗时了多少?
请求的参数以及每个系统的响应是什么?
分布式链路追踪解决了以上这些问题(当然需要自己手动扩展下)
分布式链路追踪(Distributed Tracing),就是将一次分布式请求,通过上下文形成调用链路,进行日志记录,性能监控,并将一次分布式请求的调用情况集中展示。比如各个服务节点上的耗时、请求具体到达哪台机器上、每个服务节点的请求状态等等。
Spring Cloud Sleuth 主要功能就是在分布式系统中提供追踪解决方案,并且兼容支持了 zipkin,它大量借鉴了Google Dapper 的设计。
我们看下整体的结构 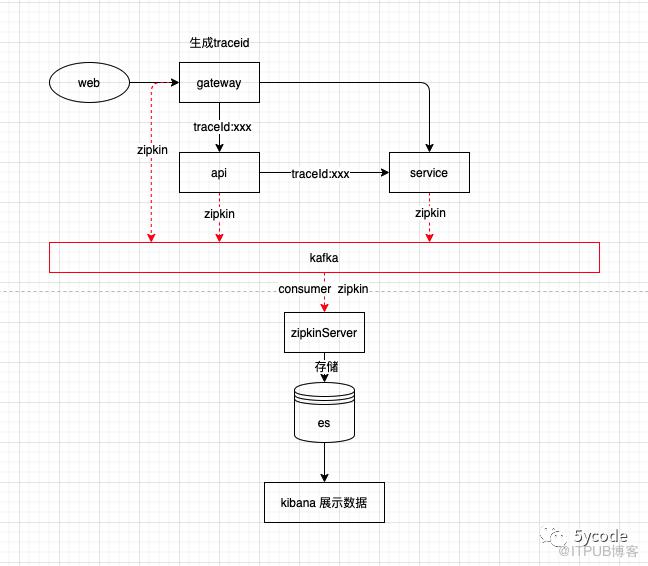
依赖引入
<spring-boot.version>2.3.10.RELEASE</spring-boot.version><spring-cloud.version>Hoxton.SR11</spring-cloud.version><parent><groupId>org.springframework.boot</groupId><artifactId>spring-boot-starter-parent</artifactId><version>2.3.10.RELEASE</version><relativePath/></parent><dependency><groupId>org.springframework.cloud</groupId><artifactId>spring-cloud-starter-sleuth</artifactId></dependency><!--接入zipkin--><dependency><groupId>org.springframework.cloud</groupId><artifactId>spring-cloud-starter-zipkin</artifactId></dependency><!--kafka start --><dependency><groupId>org.springframework.kafka</groupId><artifactId>spring-kafka</artifactId></dependency><dependency><groupId>org.apache.kafka</groupId><artifactId>kafka-clients</artifactId></dependency>

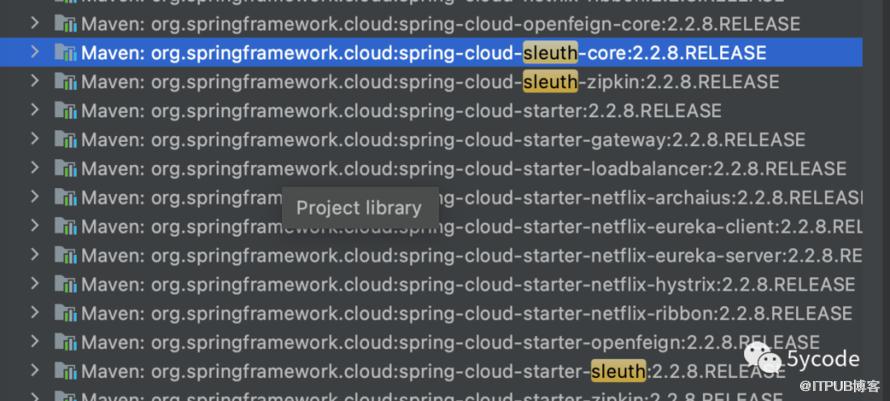
我们从spring-cloud-sleuth-core 和spring-cloud-sleuth-zipkin 中查看下spring.factories文件。
Maven: org.springframework.cloud:spring-cloud-sleuth-core:2.2.8.RELEASE文件内容=\org.springframework.cloud.sleuth.annotation.SleuthAnnotationAutoConfiguration,\org.springframework.cloud.sleuth.autoconfig.TraceAutoConfiguration,\org.springframework.cloud.sleuth.propagation.SleuthTagPropagationAutoConfiguration,\org.springframework.cloud.sleuth.instrument.web.TraceHttpAutoConfiguration,\org.springframework.cloud.sleuth.instrument.web.TraceWebServletAutoConfiguration,\org.springframework.cloud.sleuth.instrument.web.client.TraceWebClientAutoConfiguration,\org.springframework.cloud.sleuth.instrument.web.client.TraceWebAsyncClientAutoConfiguration,\org.springframework.cloud.sleuth.instrument.async.AsyncAutoConfiguration,\org.springframework.cloud.sleuth.instrument.async.AsyncCustomAutoConfiguration,\org.springframework.cloud.sleuth.instrument.async.AsyncDefaultAutoConfiguration,\org.springframework.cloud.sleuth.instrument.scheduling.TraceSchedulingAutoConfiguration,\org.springframework.cloud.sleuth.instrument.web.client.feign.TraceFeignClientAutoConfiguration,\org.springframework.cloud.sleuth.instrument.hystrix.SleuthHystrixAutoConfiguration,\org.springframework.cloud.sleuth.instrument.circuitbreaker.SleuthCircuitBreakerAutoConfiguration,\org.springframework.cloud.sleuth.instrument.rxjava.RxJavaAutoConfiguration,\org.springframework.cloud.sleuth.instrument.reactor.TraceReactorAutoConfiguration,\org.springframework.cloud.sleuth.instrument.web.TraceWebFluxAutoConfiguration,\org.springframework.cloud.sleuth.instrument.zuul.TraceZuulAutoConfiguration,\org.springframework.cloud.sleuth.instrument.rpc.TraceRpcAutoConfiguration,\org.springframework.cloud.sleuth.instrument.grpc.TraceGrpcAutoConfiguration,\org.springframework.cloud.sleuth.instrument.messaging.SleuthKafkaStreamsConfiguration,\org.springframework.cloud.sleuth.instrument.messaging.TraceMessagingAutoConfiguration,\org.springframework.cloud.sleuth.instrument.messaging.TraceSpringIntegrationAutoConfiguration,\org.springframework.cloud.sleuth.instrument.messaging.TraceSpringMessagingAutoConfiguration,\org.springframework.cloud.sleuth.instrument.messaging.websocket.TraceWebSocketAutoConfiguration,\org.springframework.cloud.sleuth.instrument.opentracing.OpentracingAutoConfiguration,\org.springframework.cloud.sleuth.instrument.redis.TraceRedisAutoConfiguration,\org.springframework.cloud.sleuth.instrument.quartz.TraceQuartzAutoConfiguration# Environment Post Processor=\org.springframework.cloud.sleuth.autoconfig.TraceEnvironmentPostProcessorMaven: org.springframework.cloud:spring-cloud-sleuth-zipkin:2.2.8.RELEASE文件内容=\org.springframework.cloud.sleuth.zipkin2.ZipkinAutoConfiguration,\org.springframework.cloud.sleuth.zipkin2.ZipkinBackwardsCompatibilityAutoConfiguration
我们先看下sleuth的TraceAutoConfiguration
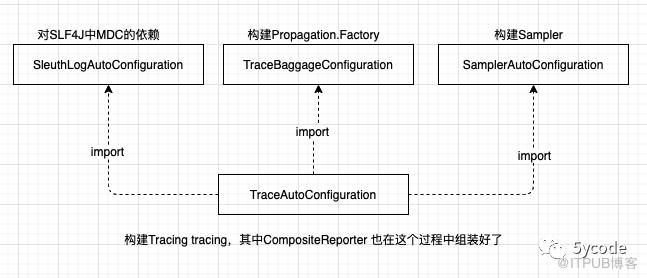
再往下看instrument下面的所有类,通过名称我们也能推测是各种场景的插桩实现。springframework.cloud.sleuth.instrument.* 随便点进去一个,都是有条件依赖的实现(这是根据你的环境,推断出所有的对应的插桩实现,做到链路跟踪)。
我们看一个TraceHttpAutoConfiguration
// 构建的HttpTracing在brave包中HttpTracing httpTracing(......){}
HttpTracing 中具体的servlet场景(还有一个是httpclient) 
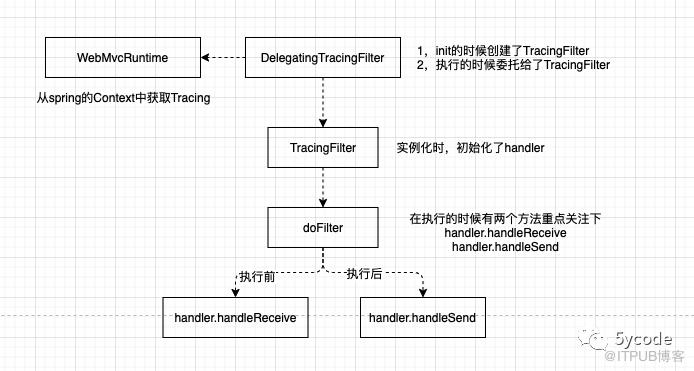
public final class HttpServerHandler<Req, Resp> extends HttpHandler {public Span handleReceive(HttpServerRequest request) {Span span = nextSpan(defaultExtractor.extract(request), request);//可以继续跟下去,最后的解析在sleuth包中的SleuthHttpClientParser,里面的tag类似于SLF4J中的MDC机制return handleStart(request, span);}public void handleSend(@Nullable Resp response, @Nullable Throwable error, Span span) {if (span == null) throw new NullPointerException("span == null");if (response == null && error == null) {throw new IllegalArgumentException("Either the response or error parameters may be null, but not both");}if (response == null) {span.error(error).finish();return;}HttpServerResponse serverResponse;if (response instanceof HttpServerResponse) {serverResponse = (HttpServerResponse) response;if (serverResponse.error() == null && error != null) {span.error(error);}} else {serverResponse = new FromResponseAdapter<>(adapter, response, error);}handleFinish(serverResponse, span);}void handleFinish(HttpResponse response, Span span) {try {parseResponse(response, span);} catch (Throwable t) {propagateIfFatal(t);Platform.get().log("error parsing response {0}", response, t);} finally {long finishTimestamp = response.finishTimestamp();if (finishTimestamp == 0L) {/*** 这里会进行资源的释放* 追到RealSpan* 追到pendingSpans* spanHandler* ZipkinSpanHandler 最后由zipkinSpanHandler进行上送*/span.finish();} else {span.finish(finishTimestamp);}}}//具体实现最后也在sleuth包中的SleuthHttpServerParservoid parseResponse(HttpResponse response, Span span) {responseParser.parse(response, span.context(), span.customizer());}}public class ZipkinSpanHandler extends SpanHandler implements Closeable {public boolean end(TraceContext context, MutableSpan span, Cause cause) {if (!this.alwaysReportSpans && !Boolean.TRUE.equals(context.sampled())) {return true;} else {//最终是CompositeReporter,对,就是TraceAutoConfiguration里的this.spanReporter.report(span);return true;}}}
多翻看一些sleuth的jar中的org.springframework.cloud.sleuth.instrument.中的配置类。
我们可以推断出
sleuth层只是按照一定的条件组装各种场景的参数构建与绑定
真正的实现在brave各个instrument包中
我们再看下spring-cloud-sleuth-zipkin中的配置
yaml中的配置文件# zipkin sender 选择spring:zipkin:compression:enabled: truesender:type: kafka关键的几个配置ZipkinAutoConfigurationZipkinSenderProperties# sender实现的条件判断,由于我们配置的sender.type=kafka只有kafka会实例化ZipkinSenderCondition extends SpringBootCondition# kafka具体的配置ZipkinKafkaSenderConfiguration
这也就和我们第一张图遥相呼应了。
sleuth 通过插桩不同的场景实现链路信息采集;
然后通过指定类型的方式,将这些信息发送到zipkinserver
zipkinserver 将对应的信息保存到指定的存储引擎(我用的是es)
kibana再链接es(用户在使用kibana的时候,能从es中查数据)
最后在根据自己的需求进行入参和出参的增强。
具体可以参考:
https://github.com/yxkong/springboot-gray.git
GatewayTracingFilter 针对gateway进行了增强TracingFilter 针对mvc进行l 增强
最终效果

原文作者:5ycode;如有侵权,请联系管理员删除。

最新文章
- DeepSeek+ragflow构建企业知识库之工作流,突然觉的dify又香了
- dify1.0.0版本升级及新功能预览
- DeepSeek+ragflow构建企业知识库:突然觉的dify不香了(1)
- DeepSeek官方充值终于开放了,相关工具推荐
- 聊聊dify权限验证的三种方案及实现
- DeepSeek+dify 工作流应用,自然语言查询数据库信息并展示
- DeepSeek+dify知识库,查询数据库的两种方式(api+直连)
- DeepSeek+dify 本地知识库:高级应用Agent+工作流
- 腾讯有Dify团队吗?difySandbox成了腾讯Dify团队开源的
- Deepseek+Dify本地知识库相关问题汇总
