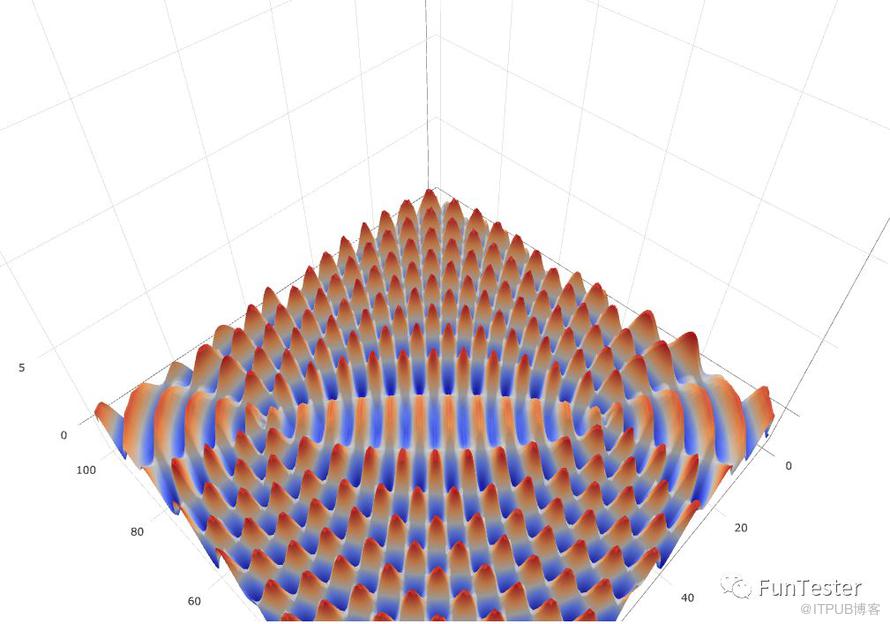
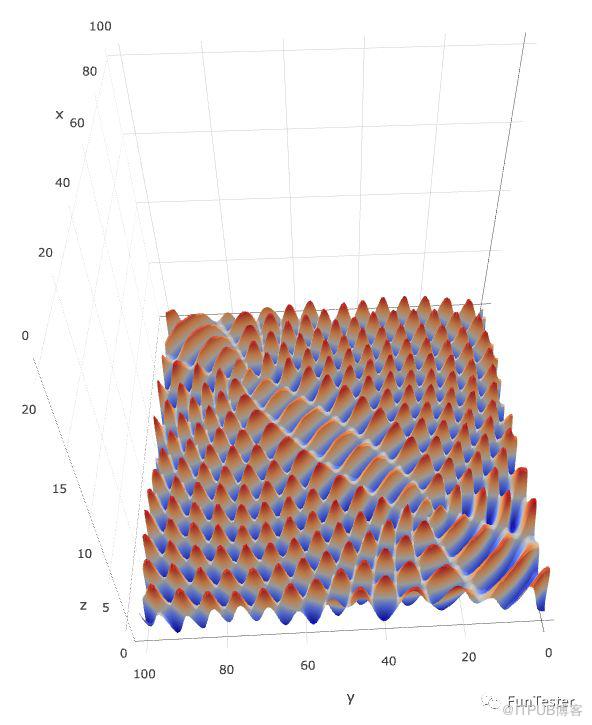
本人在学习完制作双波源干涉现象的的二维Contour Plots图像之后,发现 plotly 还有3D 图像制作,也就是3D Surface Plots,这个更能展示双波源干涉现象的结果,果然学之。中间有些地方要说明一下,3D Surface Plots图表默认的底部是正方形,所以我采用了100*100的干涉图,然后加上一层透明的图标,让图像压扁,不然图标的上下限就是波动位置,看起来非常不雅观。
下面分享代码和结果:
下面是 python部分的代码:
 1#!/usr/bin/python
 2# coding=utf-8
 3
 4import plotly.plotly
 5
 6z = []
 7with open("/Users/Vicky/Documents/workspace/fission/long/intervene.log") as apidata:
 8    for i in apidata:
 9        data = i.split("\n")[0].split(",")
10        z.append(data)
11matrix = [[20 for zij in zi] for zi in z]#为了让立体图压扁
12plotly.offline.plot([
13     dict(
14            z=z,
15            type="surface"
16    ),
17    dict(
18            z=matrix,
19            showscale=False,
20            opacity=0.01,#透明度
21            type="surface"
22    )
23], filename="2222.html")
下面是 java 部分的代码,是为了生成数据:
 1package practise;
 2
 3import java.awt.Point;
 4import java.util.ArrayList;
 5import java.util.List;
 6import source.SourceCode;
 7
 8public class Intervene extends SourceCode {
 9    public List<List<Double>> data = new ArrayList<>();
10
11    public static void main(String[] args) {
12        Intervene intervene = new Intervene();
13        intervene.testDemo001();
14    }
15
16    public void testDemo001() {
17        Point point1 = new Point(25, 25);
18        Point point2 = new Point(75, 75);
19        int lamda = 6;
20        for (int i = 0; i < 100; i++) {// y 轴
21            List<Double> distance = new ArrayList<>();
22            for (int j = 0; j < 100; j++) {// x 轴
23                Point point = new Point(j, i);
24                double x = point.distance(point1) % lamda / lamda;
25                double y = point.distance(point2) % lamda / lamda;
26                double xx = Math.sin(x * 2 * Math.PI);
27                double yy = Math.sin(y * 2 * Math.PI);
28                distance.add(xx + yy);
29            }
30            data.add(distance);
31        }
32        StringBuffer content = new StringBuffer();
33        int size = data.size();
34        for (int i = 0; i < size; i++) {
35            String text = data.get(i).toString();
36            text = text.substring(1, text.length() - 1);
37            if (i == 0)
38                content.append(text);
39            content.append(LINE + text);
40        }
41        logLong("intervene.log", content.toString());
42    }
43}
下面是3D Surface Plots图的截图:
技术类文章精选
非技术文章精选
大咖风采
点击查看公众号地图
原文作者:FunTester;如有侵权,请联系管理员删除。
上一篇:
groovy爬虫实例——历史上的今天
下一篇:
电子书网站爬虫实践

请登录后发表评论
登录
全部评论
