[数据可视化]绘制持仓榜单的“棒棒糖图”
1. 需求
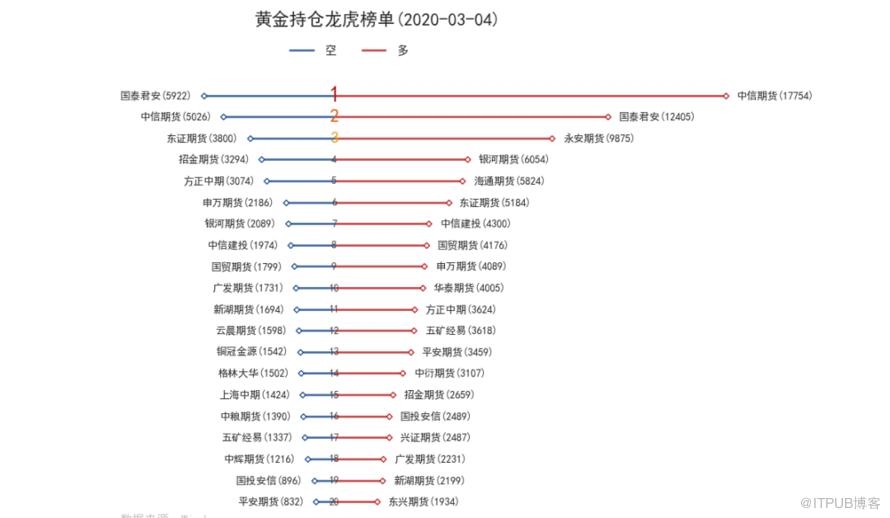
2. Plotly
3. Dash
4. 安装
pip install plotly dash或者也可以用 conda 进行安装。
5. 数据格式和数据处理

excel_pd = pd.read_excel('data/IC期货商历史数据(1).xlsx', index_col='日期')# 去空excel_pd.dropna()# 去除000905_SH列excel_pd = excel_pd.drop(labels='000905_SH', axis=1)# 去0行excel_pd = excel_pd[~(excel_pd == 0).all(axis=1)]# 取出时间列表,获取最大日期和最小日期,为日历选项做判断date_list = excel_pd.index.values.tolist()min_date = min(date_list)max_date = max(date_list)
def get_data_via_date_from_excel(date):# 筛选日期sheet1_data = excel_pd.loc[date]# 去除列值为0sheet1_data = sheet1_data[sheet1_data != 0]# 排序 从小到大sheet1_data = sheet1_data.sort_values()# 空仓short_hold = sheet1_data[sheet1_data < 0]# 多仓long_hold = sheet1_data[sheet1_data >= 0].sort_values(ascending=False)return short_hold, long_hold
6. 画图
Matplotlib画图
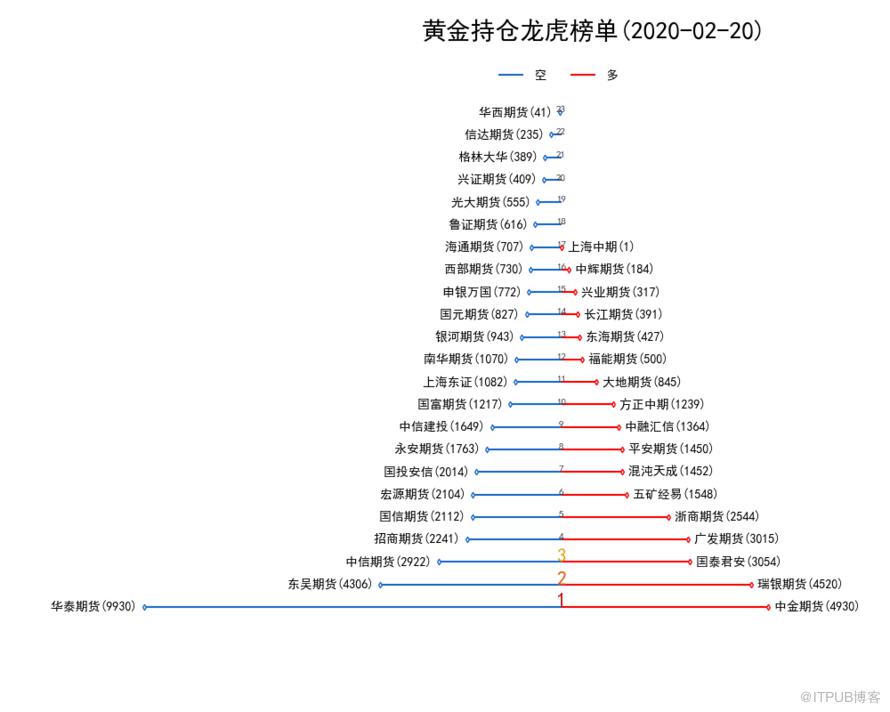
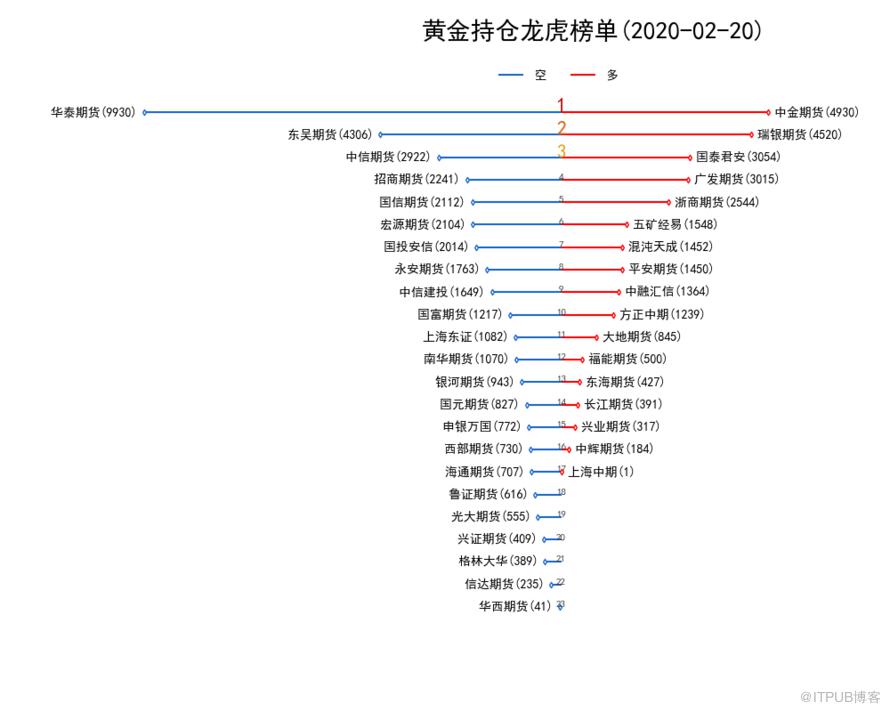
def draw_lollipop_graph(short_hold, long_hold, date):# sheet_major.index.values.tolist()fig, ax = plt.subplots(figsize=(10, 8))# 空仓水平线ax.hlines(y=[i for i in range(len(short_hold))], xmin=list(short_hold), xmax=[0] * len(short_hold.index), color='#1a68cc', label='空')# 多仓水平线ax.hlines(y=[i for i in range(len(long_hold))], xmax=list(long_hold), xmin=[0] * len(long_hold.index), color='red', label='多')# 画散点ax.scatter(x=list(short_hold), y=[i for i in range(len(short_hold))], s=10, marker='d', edgecolors="#1a68cc", zorder=2, color='white') # zorder设置该点覆盖线ax.scatter(x=list(long_hold), y=[i for i in range(len(long_hold))], s=10, marker='d', edgecolors="red", zorder=2, color='white') # zorder设置该点覆盖线# 画线两端标注图for x, y, label in zip(list(short_hold), range(len(short_hold)), short_hold.index):plt.text(x=x, y=y, s=label+'({}) '.format(abs(x)), horizontalalignment='right', verticalalignment='center', fontsize=10)for x, y, label in zip(list(long_hold), range(len(long_hold)), long_hold.index):plt.text(x=x, y=y, s=' '+label+'({})'.format(abs(x)), horizontalalignment='left', verticalalignment='center', fontsize=10)# 设置排名size = [17, 16, 15] + [8 for i in range(max(len(short_hold), len(long_hold))-3)]color = ['#b91818', '#e26012', '#dd9f10'] + ['#404040' for i in range(max(len(short_hold), len(long_hold))-3)]for i, s, c in zip(range(max(len(short_hold), len(long_hold))+1), size, color):plt.annotate(s=i+1, xy=(0, i), fontsize=s, ma='center', ha='center', color=c)# 坐标轴y反置ax.invert_yaxis()# 坐标轴不可见ax.set_xticks([])ax.set_yticks([])ax.spines['top'].set_visible(False) # 去上边框ax.spines['bottom'].set_visible(False) # 去下边框ax.spines['left'].set_visible(False) # 去左边框ax.spines['right'].set_visible(False) # 去右边框# 设置titleax.set_title('黄金持仓龙虎榜单({})'.format(date), position=(0.7, 1.07), fontdict=dict(fontsize=20, color='black'))# 自动获取ax图例句柄及其标签handles, labels = ax.get_legend_handles_labels()plt.legend(handles=handles, ncol=2, bbox_to_anchor=(0.75, 1.05), labels=labels, edgecolor='white', fontsize=10)# 保存figimage_filename = "lollipop_rank.png"plt.savefig(image_filename)encoded_image = base64.b64encode(open(image_filename, 'rb').read())# plt.show()return encoded_image
Plotly画图
import plotly.graph_objects as gofig = go.Figure() # 创建空画布fig.show()
fig = go.Figure(data=[trace1, trace2]) # 定义figure时加上轨迹数据Figure.add_traces(data[, rows, cols, …]) # 或者先定义一张空的画布,再添加轨迹Figure.update_traces([patch, selector, row, …]) # 更新轨迹# 可运行代码import plotly.graph_objects as gotrace = [go.Scatter( # 创建tracex=[0, 1, 2],y=[2, 2, 2],mode="markers",marker=dict(color="#1a68cc", size=20),)]fig = go.Figure(data=trace)fig.show()
import plotly.graph_objects as gotrace = [go.Scatter(x=[0, 1, 2],y=[2, 2, 2],mode="markers",marker=dict(color="#1a68cc", size=20),)]# 创建layout,添加标题layout = go.Layout(title=go.layout.Title(text="Converting Graph Objects To Dictionaries and JSON"))fig = go.Figure(data=trace, layout=layout)fig.show()Figure.update_layout([dict1, overwrite]) # 也可使用API更新图层
# 空仓水平线short_shapes = [{'type': 'line','yref': 'y1','y0': k,'y1': k,'xref': 'x1','x0': 0,'x1': i,'layer': 'below','line': dict(color="#1a68cc",),} for i, k in zip(short_hold, range(len(short_hold)))]# 多仓水平线long_shapes = [{'type': 'line','yref': 'y1','y0': k,'y1': k,'xref': 'x1','x0': j,'x1': 0,'layer': 'below','line': dict(color="red",)} for j, k in zip(long_hold, range(len(long_hold)))]
# 画散点fig.add_trace(go.Scatter(x=short_hold,y=[i for i in range(len(short_hold))],mode='markers+text',marker=dict(color="#1a68cc", symbol='diamond-open'),text=[label + '(' + str(abs(i)) + ') ' for label, i in zip(short_hold.index, short_hold)], # 散点两端的期货公司标注和持仓数textposition='middle left', # 标注文字的位置showlegend=False # 该轨迹不显示图例legend))fig.add_trace(go.Scatter(x=long_hold,y=[i for i in range(len(long_hold))],mode='markers+text',text=[' ' + label + '(' + str(abs(i)) + ')' for label, i in zip(long_hold.index, long_hold)], # 散点两端的期货公司标注和持仓数marker=dict(color='red', symbol='diamond-open'),textposition='middle right', # 标注文字的位置showlegend=False # 该轨迹不显示图例legend))
# 线上的排名顺序fig.add_trace(go.Scatter(x=[0]*max(len(short_hold), len(long_hold)),y=[i for i in range(max(len(short_hold), len(long_hold)))],mode='text',text=[str(i+1) for i in range(max(len(short_hold), len(long_hold)))], # 排名从1开始textfont=dict(color=['#b91818', '#e26012', '#dd9f10'] + ['#404040' for i in range(max(len(short_hold), len(long_hold)) - 3)],size=[17, 16, 15] + [10 for i in range(max(len(short_hold), len(long_hold)) - 3)],family="Open Sans"),textposition='top center',showlegend=False))

# 加上这条trace只是为了显示legend图例,因为scatter图例中显示的text在plotly现有的版本基础上去除不了fig.add_trace(go.Scatter(x=[0, long_hold[0]],y=[range(len(long_hold))[0], range(len(long_hold))[0]],mode='lines',marker=dict(color='red'),name='多'))fig.add_trace(go.Scatter(x=[0, short_hold[0]],y=[range(len(short_hold))[0], range(len(short_hold))[0]],mode='lines',marker=dict(color='#1a68cc'),name='空'))
# X, Y坐标轴不可见fig.update_xaxes( showticklabels=False, showgrid=False, zeroline=False,)fig.update_yaxes( showticklabels=False, showgrid=False, zeroline=False, autorange='reversed' # Y 轴倒置)fig.update_layout(shapes=short_shapes+long_shapes, # 添加水平线 width=2100, height=900, legend=dict(x=0.62, y=1.02, orientation='h'), template="plotly_white", title=dict( text='黄金持仓龙虎榜单(' + date + ')', y=0.95, x=0.65, xanchor='center', yanchor='top', font=dict(family="Open Sans", size=30) ))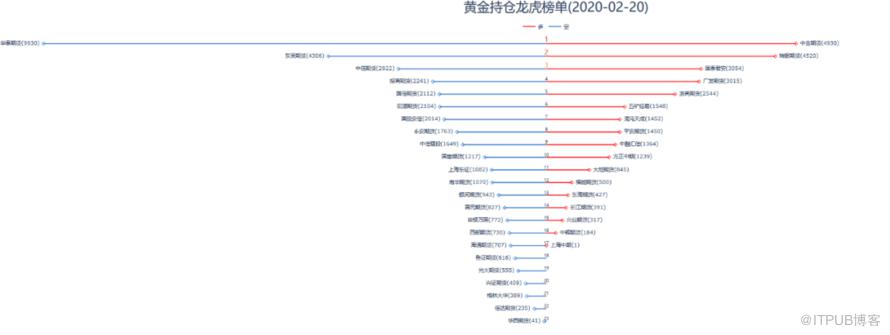
7. 创建Dash 应用程序
import dashimport dash_html_components as htmlimport dash_core_components as dccexternal_stylesheets = ['https://codepen.io/chriddyp/pen/bWLwgP.css']app = dash.Dash(__name__, external_stylesheets=external_stylesheets)app.layout = html.Div([html.Div(dcc.DatePickerSingle(id='my-date-picker-single',min_date_allowed=min_date, # 日历最小日期max_date_allowed=max_date, # 日历最大日期date=max_date # dash 程序初始化日历的默认值日期), style={"margin-left": "300px"}),html.Div(id='output-container-date-picker-single', style={"text-align": "center"})])
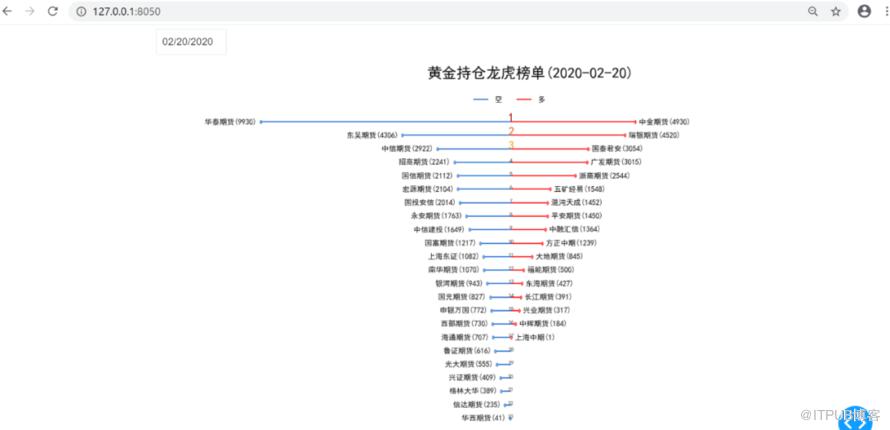
Matplotlib + Dash 框架
@app.callback(Output('output-container-date-picker-single', 'children'),[Input('my-date-picker-single', 'date')])def update_output(date):print("date", date)if date is not None:if date not in date_list:return html.Div(["数据不存在"])encoded_image = create_figure(date)return html.Div([html.Img(src='data:image/png;base64,{}'.format(encoded_image.decode()), style={"text-align": "center"})])if __name__ == '__main__':app.run_server(debug=True)

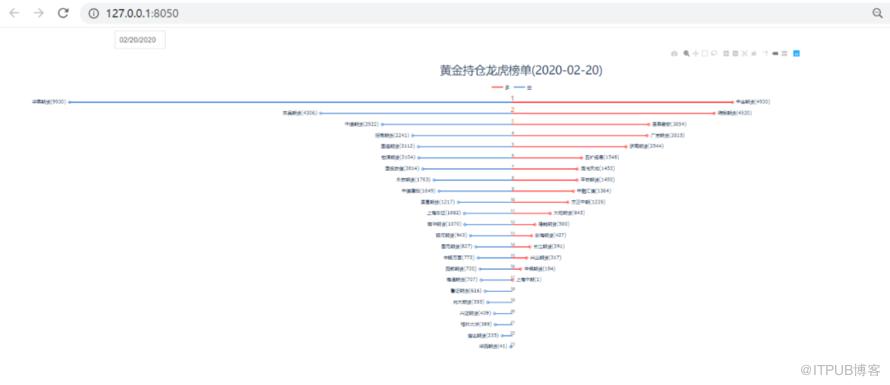
Plotly + Dash 框架
@app.callback(Output('output-container-date-picker-single', 'children'),[Input('my-date-picker-single', 'date')])def update_output(date):print("date", date)if date is not None:if date not in date_list:return html.Div(["数据不存在"])fig = create_figure(date)return html.Div([dcc.Graph(figure=fig)])if __name__ == '__main__':app.run_server(debug=True) # 启动应用程序
8. 结语

原文作者:Crossin的编程教室;如有侵权,请联系管理员删除。
上一篇:
Crossin:有必要学编程吗?
下一篇:
用Python动画来展示二阶贝赛尔曲线

请登录后发表评论
登录
全部评论
