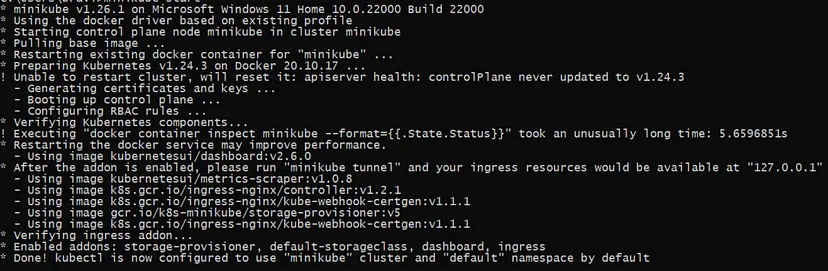
minikube start --driver=docker
sudo apt-get install helm
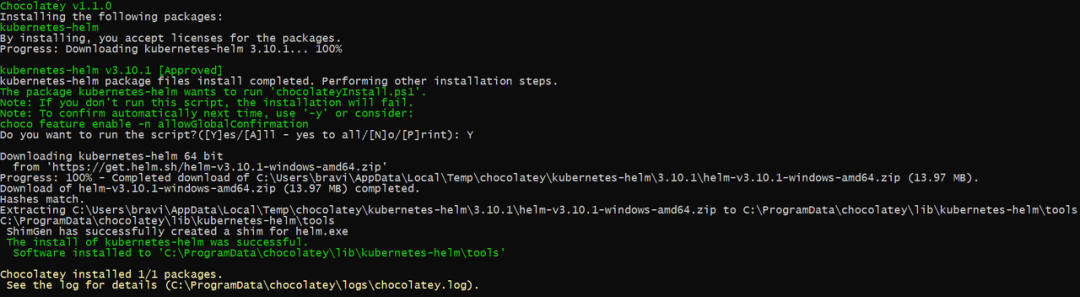
choco install Kubernetes-helm
brew install helm
helm
The Kubernetes package manager
Common actions for Helm:
- helm search:    search for charts
- helm pull:      download a chart to your local directory to view
- helm install:   upload the chart to Kubernetes
- helm list:      list releases of charts
Usage:
  helm [command]
Available Commands:
  completion  generate autocompletion scripts for the specified shell
  create      create a new chart with the given name
  dependency  manage a chart's dependencies
  env         helm client environment information
  get         download extended information of a named release
  help        Help about any command
  history     fetch release history
  install     install a chart
  lint        examine a chart for possible issues
  list        list releases
  package     package a chart directory into a chart archive
  plugin      install, list, or uninstall Helm plugins
  pull        download a chart from a repository and (optionally) unpack it in local directory
  push        push a chart to remote
  registry    login to or logout from a registry
  repo        add, list, remove, update, and index chart repositories
  rollback    roll back a release to a previous revision
  search      search for a keyword in charts
  show        show information of a chart
  status      display the status of the named release
  template    locally render templates
  test        run tests for a release
  uninstall   uninstall a release
  upgrade     upgrade a release
  verify      verify that a chart at the given path has been signed and is valid
  version     print the client version information
Use "helm [command] --help" for more information about a command.
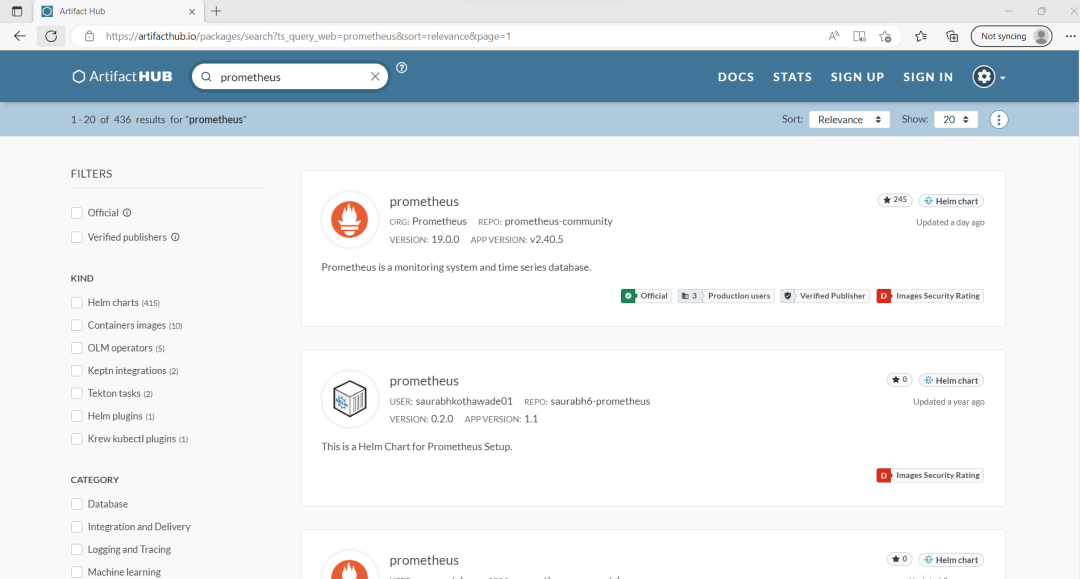
helm search hub prometheus
URL                                                       CHART VERSION         APP VERSION                                           DESCRIPTION
https://artifacthub.io/packages/helm/prometheus...        25.1.0                v2.47.0                                               Prometheus is a monitoring system and time seri...
https://artifacthub.io/packages/helm/truecharts...        13.0.7                2.47.1                                                kube-prometheus-stack collects Kubernetes manif...
https://artifacthub.io/packages/helm/saurabh6-p...        0.2.0                 1.1                                                   This is a Helm Chart for Prometheus Setup.
https://artifacthub.io/packages/helm/prometheus...        13.0.0                2.22.1                                                Prometheus is a monitoring system and time seri...
https://artifacthub.io/packages/helm/wenerme/pr...        25.1.0                v2.47.0                                               Prometheus is a monitoring system and time seri...
https://artifacthub.io/packages/helm/wener/prom...        25.1.0                v2.47.0                                               Prometheus is a monitoring system and time seri...
https://artifacthub.io/packages/helm/romanow-he...        1.3.5                 2.40.0                                                Prometheus collects and stores its metrics as t...
https://artifacthub.io/packages/helm/mach1el-ch...        1.0.1                 v2.47.0                                               Prometheus Helm chart for Kubernetes
https://artifacthub.io/packages/helm/cloudposse...        0.2.1                                                                       Prometheus instance created by the CoreOS Prome...
helm repo add prometheus-community https://prometheus-community.github.io/helm-charts
helm repo update
"prometheus-community" has been added to your repositories
Hang tight while we grab the latest from your chart repositories...
...Successfully got an update from the "grafana" chart repository
...Successfully got an update from the "prometheus-community" chart repository
...Successfully got an update from the "bitnami" chart repository
Update Complete. ⎈Happy Helming!⎈
helm install prometheus prometheus-community/prometheus
NAME: my-prometheus
LAST DEPLOYED: Thu Oct 12 20:06:57 2023
NAMESPACE: monitoring
STATUS: deployed
REVISION: 1
TEST SUITE: None
NOTES:
The Prometheus server can be accessed via port 80 on the following DNS name from within your cluster:
my-prometheus-server.monitoring.svc.cluster.local
Get the Prometheus server URL by running these commands in the same shell:
  export POD_NAME=$(kubectl get pods --namespace monitoring -l "app.kubernetes.io/name=prometheus,app.kubernetes.io/instance=my-prometheus" -o jsonpath="{.items[0].metadata.name}")
  kubectl --namespace monitoring port-forward $POD_NAME 9090
The Prometheus alertmanager can be accessed via port 9093 on the following DNS name from within your cluster:
my-prometheus-alertmanager.monitoring.svc.cluster.local
Get the Alertmanager URL by running these commands in the same shell:
  export POD_NAME=$(kubectl get pods --namespace monitoring -l "app.kubernetes.io/name=alertmanager,app.kubernetes.io/instance=my-prometheus" -o jsonpath="{.items[0].metadata.name}")
  kubectl --namespace monitoring port-forward $POD_NAME 9093
#################################################################################
######   WARNING: Pod Security Policy has been disabled by default since    #####
######            it deprecated after k8s 1.25+. use                        #####
######            (index .Values "prometheus-node-exporter" "rbac"          #####
###### .          "pspEnabled") with (index .Values                         #####
######            "prometheus-node-exporter" "rbac" "pspAnnotations")       #####
######            in case you still need it.                                #####
#################################################################################
The Prometheus PushGateway can be accessed via port 9091 on the following DNS name from within your cluster:
my-prometheus-prometheus-pushgateway.monitoring.svc.cluster.local
Get the PushGateway URL by running these commands in the same shell:
  export POD_NAME=$(kubectl get pods --namespace monitoring -l "app=prometheus-pushgateway,component=pushgateway" -o jsonpath="{.items[0].metadata.name}")
  kubectl --namespace monitoring port-forward $POD_NAME 9091
For more information on running Prometheus, visit:
https://prometheus.io/kubectl get all
NAME                                                        READY   STATUS    RESTARTS   AGE
pod/my-prometheus-prometheus-node-exporter-d5l8m            1/1     Running   0          27m
pod/my-prometheus-prometheus-node-exporter-kfbxb            1/1     Running   0          27m
pod/my-prometheus-prometheus-pushgateway-86d6f795cb-mlb7d   1/1     Running   0          27m
pod/my-prometheus-kube-state-metrics-6c4b65c7b9-wbh9r       1/1     Running   0          27m
pod/my-prometheus-prometheus-node-exporter-2z7rp            1/1     Running   0          27m
pod/my-prometheus-alertmanager-0                            1/1     Running   0          27m
pod/my-prometheus-server-795d8fc685-zcfct                   2/2     Running   0          27m
NAME                                             TYPE        CLUSTER-IP      EXTERNAL-IP   PORT(S)    AGE
service/my-prometheus-alertmanager-headless      ClusterIP   None            <none>        9093/TCP   27m
service/my-prometheus-server                     ClusterIP   10.43.186.10    <none>        80/TCP     27m
service/my-prometheus-prometheus-pushgateway     ClusterIP   10.43.154.83    <none>        9091/TCP   27m
service/my-prometheus-alertmanager               ClusterIP   10.43.217.41    <none>        9093/TCP   27m
service/my-prometheus-kube-state-metrics         ClusterIP   10.43.168.65    <none>        8080/TCP   27m
service/my-prometheus-prometheus-node-exporter   ClusterIP   10.43.195.241   <none>        9100/TCP   27m
NAME                                                    DESIRED   CURRENT   READY   UP-TO-DATE   AVAILABLE   NODE SELECTOR            AGE
daemonset.apps/my-prometheus-prometheus-node-exporter   3         3         3       3            3           kubernetes.io/os=linux   27m
NAME                                                   READY   UP-TO-DATE   AVAILABLE   AGE
deployment.apps/my-prometheus-prometheus-pushgateway   1/1     1            1           27m
deployment.apps/my-prometheus-kube-state-metrics       1/1     1            1           27m
deployment.apps/my-prometheus-server                   1/1     1            1           27m
NAME                                                              DESIRED   CURRENT   READY   AGE
replicaset.apps/my-prometheus-prometheus-pushgateway-86d6f795cb   1         1         1       27m
replicaset.apps/my-prometheus-kube-state-metrics-6c4b65c7b9       1         1         1       27m
replicaset.apps/my-prometheus-server-795d8fc685                   1         1         1       27m
NAME                                          READY   AGE
statefulset.apps/my-prometheus-alertmanager   1/1     27m
kubectl get service
NAME                                     TYPE        CLUSTER-IP      EXTERNAL-IP   PORT(S)    AGE
my-prometheus-alertmanager-headless      ClusterIP   None            <none>        9093/TCP   28m
my-prometheus-server                     ClusterIP   10.43.186.10    <none>        80/TCP     28m
my-prometheus-prometheus-pushgateway     ClusterIP   10.43.154.83    <none>        9091/TCP   28m
my-prometheus-alertmanager               ClusterIP   10.43.217.41    <none>        9093/TCP   28m
my-prometheus-kube-state-metrics         ClusterIP   10.43.168.65    <none>        8080/TCP   28m
my-prometheus-prometheus-node-exporter   ClusterIP   10.43.195.241   <none>        9100/TCP   28m
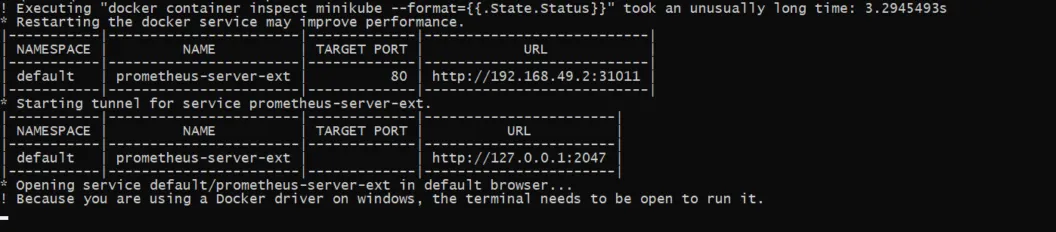
kubectl expose service prometheus-server --type=NodePort --target-port=9090 --name=prometheus-server-ext
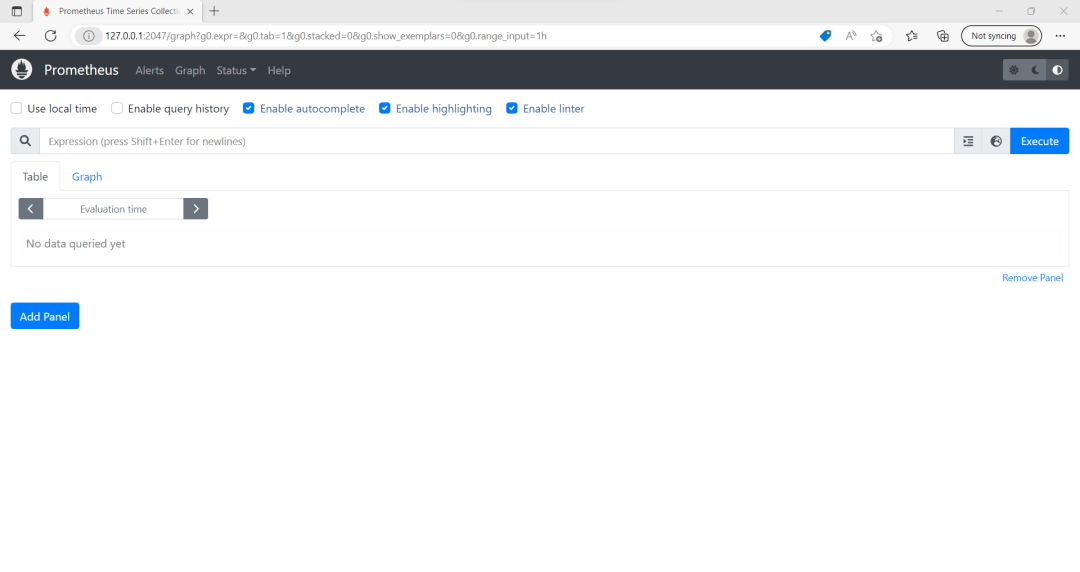
minikube service prometheus-server-ext
来自 “ ITPUB博客 ” ,链接:https://blog.itpub.net/70026925/viewspace-3003324/ ,如需转载,请注明出处,否则将追究法律责任。

请登录后发表评论
登录
全部评论
