使用 VictoriaMetrics 采集 TiDB 监控
刚好一直听说过 VictoriaMetrics,后面用 VM 来简称,因为 VM 一直号称是 Prometheus 兼容的,而且性能更好,所以我也简单的尝试了下。首先直接下载 VM 的 binary,随便解压到一个目录就可以使用了。
使用 tiup 启动 TiDB 集群:
tiup --tag 6.0 playground 6.0这里我使用了 tag 的方式,这样整个数据会存放到 ~/.tiup/data/6.0 下面。
启动 VM ./victoria-metrics-prod -promscrape.config ~/.tiup/data/6.0/prometheus/prometheus.yml -promscrape.config.strictParse=false,这里必须使用 strictParse=false ,因为 VM 还是有一些不能解析的 Prometheus 配置,不过 VM 的易用性做的还是很不错的,在报错的时候能直接提示你应该怎么做,如下:
cannot parse Prometheus config from "/Users/tangliu/.tiup/data/6.0/prometheus/prometheus.yml": cannot unmarshal data: yaml: unmarshal errors:
 line 4: field evaluation_interval not found in type promscrape.GlobalConfig
 line 8: field alerting not found in type promscrape.Config
 line 15: field rule_files not found in type promscrape.Config; pass -promscrape.config.strictParse=false command-line flag for ignoring unknown fields in yaml config
当都启动之后,我简单的使用 go-tpc 进行了 TPCC 测试,
./go-tpc tpcc --warehouses 4 -T 4 prepare
./go-tpc tpcc --warehouses 4 -T 4 run
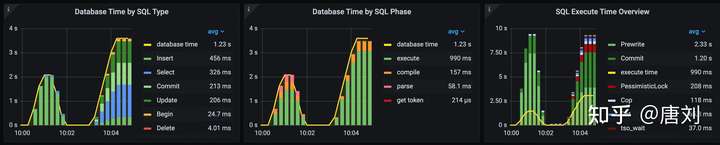
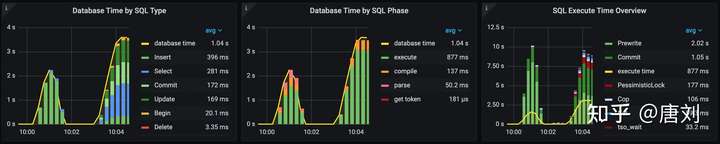
在 Grafana 里面重新创建了一个 Prometheus 的 source,使用的是 VM 的 Link,然后我导入 TiDB 性能分析和优化方法 里面的配置 performance_overview.json。
下面是使用 VM 和 Prometheus 的 Grafana Panel 对比,可以看出来,两者还是比较类似的,不过 metrics 的 value 稍微不一样,这个也是后面需要去研究的,可能是精度问题吧,不过从另一方面来说,至少能证明 VM 替换掉 Prometheus 的可能性。
VM:
Prometheus:
上面只是我的一个简单尝试,后面还需要做更多的实验来证明,在不同的情况下面,VM 真的表现更好,如果大家有兴趣,可以在 TiDB Internals 来讨论。
来源 https://zhuanlan.zhihu.com/p/513590291
来自 “ ITPUB博客 ” ,链接:https://blog.itpub.net/69999831/viewspace-3127170/ ,如需转载,请注明出处,否则将追究法律责任。

