使用yellowbrick选择K-Means最佳的K值
安装yellowbrick
pip install yellowbrick代码
import pandas as pd
from sklearn.cluster import KMeans
from yellowbrick.cluster.elbow import kelbow_visualizer


datafile= r"../../ML_data/iris.csv"
data_df = pd.read_csv(datafile,header =0)

X = data_df[["sepal_length","sepal_width","petal_length","petal_width"]]

oz = kelbow_visualizer(KMeans(random_state=1), X, k=(2,10))
k = oz.elbow_value_
print(f"最佳的K值是{k}")
print(f"elbow_score_值是{oz.elbow_score_}")
得到的拐肘图如下
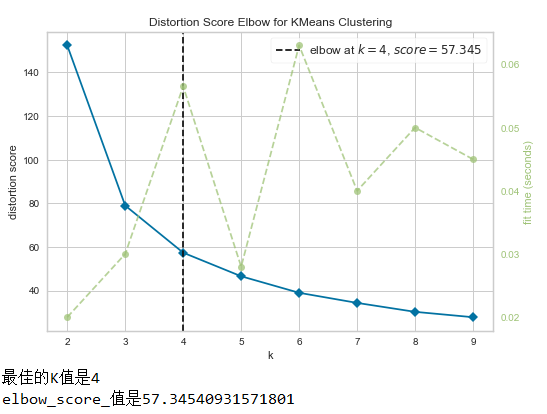
从图中可以看出最佳的K值是4.
kelbow_visualizer的参数metric 表示度量每个点到其质心的距离之和的方法
metric : string, default: ``"distortion"``
        Select the scoring metric to evaluate the clusters. The default is the
        mean distortion, defined by the sum of squared distances between each
        observation and its closest centroid. Other metrics include:

        - **distortion**: mean sum of squared distances to centers
        - **silhouette**: mean ratio of intra-cluster and nearest-cluster
                          distance
        - **calinski_harabasz**: ratio of within to between cluster dispersion
分别用这三种度量方法
kelbow_visualizer(KMeans(random_state=1), X, k=(2,10),metric='distortion')
kelbow_visualizer(KMeans(random_state=1), X, k=(2,10),metric='silhouette')
kelbow_visualizer(KMeans(random_state=1), X, k=(2,10),metric='calinski_harabasz')
得到的拐肘图分别如下
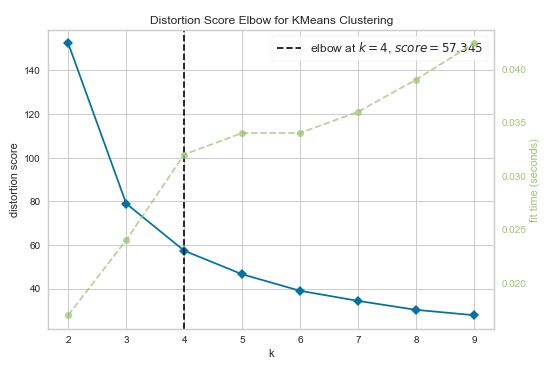
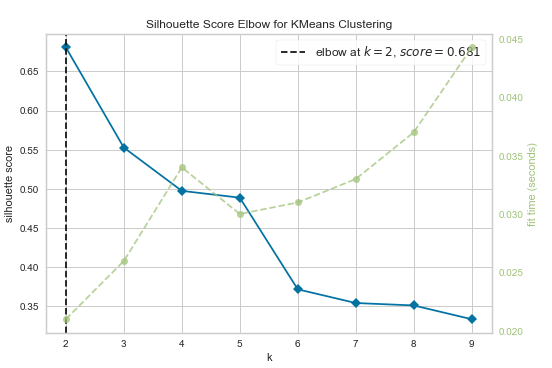
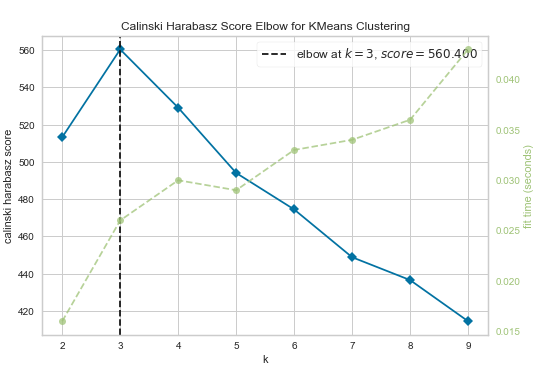
这三种度量方法得到的K值分别是4、4、3.
来源 https://zhuanlan.zhihu.com/p/396665902
来自 “ ITPUB博客 ” ,链接:https://blog.itpub.net/69999831/viewspace-3123310/ ,如需转载,请注明出处,否则将追究法律责任。

请登录后发表评论
登录
全部评论
