今天给大家介绍一款非常好用的监控工具,percona出品的pmm2。该工具主要是封装了VictoriaMetrics(Promethuse的替代品,和Promethuse API兼容)、Grafana、ClickHouse等优秀产品,可以实现MySQL、MongoDB、PostgreSQL数据库的监控(其他库也可以自定义实现),有丰富的默认监控指标与看板。除此之外,集成的慢查询分析功能也非常香。开箱即用!
架构图
安装步骤
第一步 安装 docker
#centos8
#1. 下载docker-ce的repo
curl https://download.docker.com/linux/centos/docker-ce.repo -o /etc/yum.repos.d/docker-ce.repo
#2. 安装依赖(这是相比centos7的关键步骤)
yum install https://download.docker.com/linux/fedora/30/x86_64/stable/Packages/containerd.io-1.2.6-3.3.fc30.x86_64.rpm
#3. 安装docker-ce
yum install docker-ce -y
#4. 启动docker
systemctl start docker
第二步 安装pmm-server
#拉取镜像
docker pull percona/pmm-server:2
#创建数据卷
docker volume create pmm-data
#启动容器
docker run --detach --restart always --publish 443:443 -v pmm-data:/srv --name pmm-server percona/pmm-server:2
#修改admin密码
docker exec -t pmm-server change-admin-password passwordxxx
#查看日志
docker logs  pmm-server
#查看网页 (非本地环境localhost换成机器ip 注意防火墙要开通)
#账户:admin 密码:passwordxxx (参考修改admin密码步骤的密码)
https://localhost:443
第三步 被监控节点安装 pmm-client
#1 配置yum源
yum install -y https://repo.percona.com/yum/percona-release-latest.noarch.rpm
#2 安装pmm2-client
yum install -y pmm2-client
#3  查看版本
pmm-admin --version
#4 注册节点 注意admin账户密码和ip不要填错
pmm-admin config --server-insecure-tls --server-url=https://admin:passwordxxx@X.X.X.X:443

# 说明:
# X.X.X.X is the address of your PMM Server.
# 443 is the default port number.
# admin/admin is the default PMM username and password. This is the same account you use to log into the PMM user interface, which you had the option to change when first logging in.
安装完登录界面长这样,更多内容大家自行探索。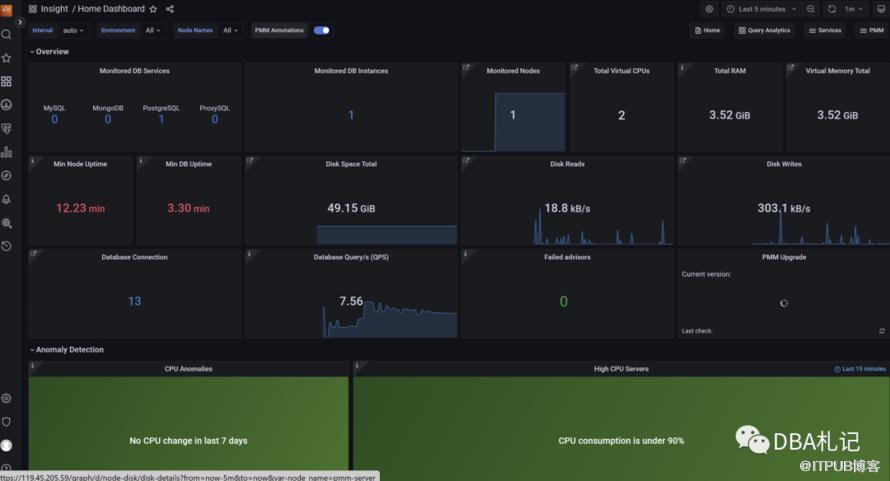
参考文档
https://docs.percona.com/percona-monitoring-and-management/index.html
今天就介绍到这里了。非常好的项目,值得让更多人知道。
欢迎关注公众号:DBA札记,一起交流数据库技术。后台回复“交流群”可添加技术交流群。欢迎觉得读完本文有收获,可以转发给其他朋友,大家一起学习进步!
原文作者:DBA札记;如有侵权,请联系管理员删除。
上一篇:
DBA必须了解的另一个github项目
下一篇:
DBA必须了解的一个github的项目

请登录后发表评论
登录
全部评论
