南大通用GBase8s数据库AF文件简介
南大通用 GBase8s 数据库 AF 文件浅谈
1. 什么是 AF 文件
GBase8s 数据库执行中发生错误时会产生AF 文件并在Online.log 中会记录一些细节:
what-- 什么类型的failure
who-- 谁report 的这个错误
when-- 什么时候发生的
where-- 收集了哪里的潜在信息
具体如下:
09:56:45 GBase 8s Database Server Version 12.10.FC4G1 Software Serial Number AAA#B000000
09:56:45 Assert Failed: No Exception Handler
09:56:45 Who: Session(4, gbasedbt@DEV-005, 9244, 0x7a97f7f8)
Thread(86, sqlexec, 7a9489e8, 10)
File: mtex.c Line: 508
09:56:45 Results: Exception Caught. Type: MT_EX_OS, Context: mem
09:56:45 Action: Please notify GBASE Techical Support.
09:56:45 See Also: /ATM/MAIN1210/dbspaces/atmol105/af.43e12dc, shmem.43e12dc.0
Who: Session(4, gbasedbt@DEV-005, 9244, 0x7a97f7f8)
The session id (sid) :4
the username :gbasedbt
The thread id (tid):86
the thread name :sqlexec
有时在online.log 或者DUMPDIR 目录下有多个AF ,主要关注初始或者第一个AF ,后续的AF 可能是被初始的AF 引起的。
2. 故障隔离级别
设置方法:
静态设置:
修改配置文件,重启后生效;
动态设置:
onmode -w(m/f) 方式修改;
检查设置:
onstat -g ras
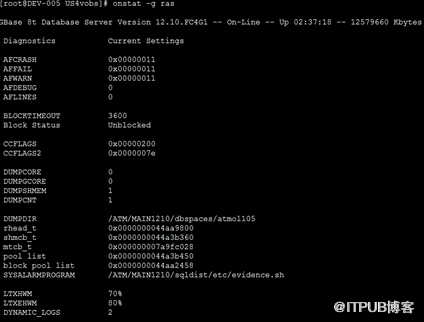
AFWARN - waning 信息对应的AF 设置
AFFAIL - failure 信息对应的AF 设置
AFCRASH - crash 信息对应的AF 设置
默认值:
AFWARN = 0x00000001
AFFAIL = 0x00000001
AFCRASH = 0x00000201
具体如下:
变量 值 作用
AFMESSAGE 0x00000001 Display message in log message file
AFCORE 0x00000002 Dump core file
AFGCORE 0x00000004 Dump gcore file
AFDUMPSHMEM 0x00000008 Dump shared memory
AFHANGSERVER 0x00000010 Hang the server
AFHANGTHREAD 0x00000020 Hang the current thread
AFCHECKHANG 0x00000040 Hang the cur thread, or the server
AFCHECKCRASH 0x00000080 Hang the cur thread, or crash server
AFCHECKRELEASE 0x00000100 Hang the cur thread, or do nothing
AFCRASHSERVER 0x00000200 Crash the server
AFSERVERSTACK 0x00000400 Generate a stack trace from oninit
AFNOEVIDENCE 0x00000800 Do NOT call evidence.sh
AF_FAST_T_HANG 0x00002000 Specifically when hanging a thread
values 可以合并执行多个行为:
例如:0x203
可以产生一个message 在message log 中;生成一个core dump ; 并且crash server 。
所有的选项都可以触发SYSALARMPROGRAM , 除非SYSALARMPROGRAM=0x800 ,AFLINES 限制 Assert Failure messages 写到af 文件中的行数。 AFLINES=0 ,所有的AF message 都会写到af 文件中。
3. 证据收集 --AF files
输出文件AF 文件,AF 文件位置: 配置文件中配置参数DUMPDIR 的值。
(1 )AF 文件中的内容:
原始写到online.log 文件中的assertion failure message
附加的debug 数据,相关memory 的hex dumps
evidence.sh 脚本的输出
(2 )af.xxxxx.rawstk 文件:
fail 、crash 的AF 文件会对应一个af.xxxxx.rawstk 文件;
文件中包含全部的stack (base+length) ,一个新的段被加到AF 文件中。类似与下面的内容:
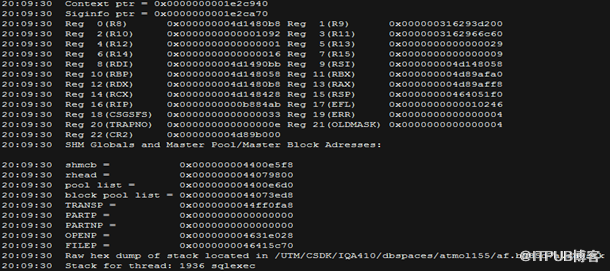
如果AF 不能正确展示stack ,可能DUMPSHMEM 是disabled 。
(3 )shmem.xxxxxxxx.0 文件:
记录出现错误的点:
all resident ;
virtual ;
communications memory segments ;
位置:DUMPDIR
参数设置:
DUMPSHMEM 1 Enabled
DUMPSHMEM 0 disabled
DUMPSHMEM 2 排除buffer pool ,极大减少大小。
Shared memory dumps 对于技术支持来说是非常宝贵的信息,记录engine failure 相关内容;onstat 命令收集了AF 文件中不包括的shared memory dump 的信息;Shared memory dumps 允许技术支持工程师检查整个实例中独立线程的key control structures 。分析shared memory dump 会找到导致bug 的原因或找到一个未经确认的问题。
(4 )onstat 读dump 文件的方法:
onstat <infile> {options}
例如:onstat shmem.1cf2059c.0 –I
> -g ath
> -g sql
AF message 中提供thread session 及thread ID
AF message 的关键组成:
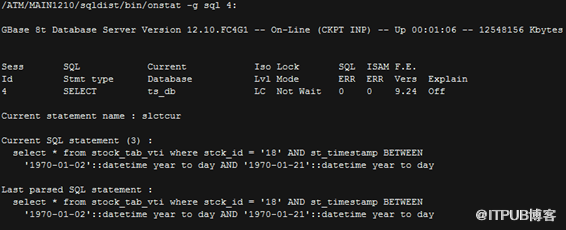
onstat -g sql <session_num>
如果AF 文件中没有onstat -g sql ,可以从shared memory dump 中获得:
onstat -g sql <session_num><shmdump_name>
af 文件中onstat -g sql 例子:
4. 故障诊断方法
( 1 ) AFDEBUG
作用:Suspend AF 或者Fail 的进程
在Online.log 的AF message 指出PID ,可以用来debugger 追踪。
设置:
开启: onmode -A 1
关闭: onmode -A 0
通过onstat -g ras 检查AFDEBUG 的值
开启AFDEBUG 可以得到很好的stack trace
( 2 ) Error Trapping
如果有error 发生,但是没有AF 文件生成,可以使用下面命令:
onmode -I <error_num>[,<session_id>]
例如:下面的命令指示engine 生成一个发生语法错误的assertion failure
onmode -I 201
清除所有在Server 上的捕获error
onmode -I
如果必要的话可以和AFDEBUG 一起使用来hang Server ,不能用来捕获网络errors ( 例如 -27001 error)
官网:
来自 “ ITPUB博客 ” ,链接:https://blog.itpub.net/69980677/viewspace-2744371/ ,如需转载,请注明出处,否则将追究法律责任。

