obdiag介绍
OceanBase 敏捷诊断工具(OceanBase Diagnostic Tool,简称obdiag)是一款源代码开源敏捷黑屏诊断工具,可以对OceanBase集群进行一键集群巡检、一键分析以及一键诊断信息收集。

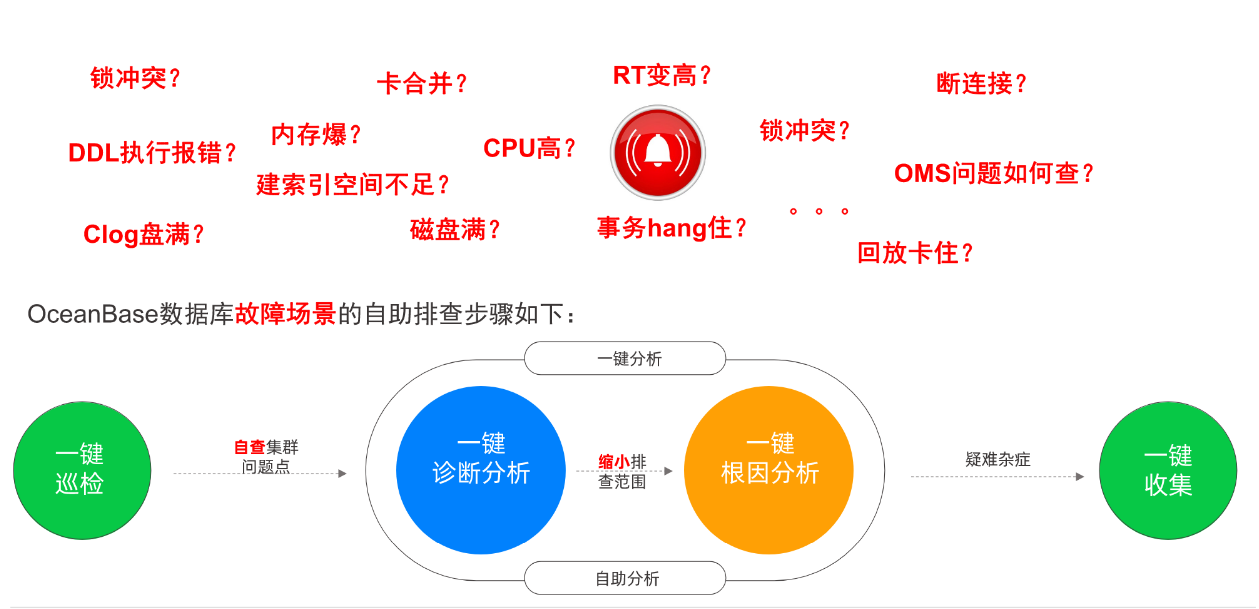
obdiag 有五大核心功能,分别是: 一键集群巡检、一键信息收集、一键分析、一键根因分析、一键集群洞察。
obdiag 具有以下特点:
- 部署简单:提供 RPM 包和 obd 上部署的模式,均可一键部署安装,可以选择部署到任意一台能连接到集群各个节点的机器上,并不局限于 OBServer 节点。
- 集中式收集:obdiag 程序单点部署,无需每台服务器部署,使用的时候只需要在部署机器上执行收集、巡检或分析命令即可。
- 简单易用:一条命令搞定安装,一键集群巡检、一键信息收集、一键诊断分析、一键根因分析等功能全部可以通过一条命令搞定,简单易用。
- 完全开源:obdiag 是 python 代码开发的,源代码100%开源,详细信息请参见 GitHub代码仓库
- 高度可扩展:obdiag 的一键巡检功能、一键场景化信息收集功能、一键根因分析功能、一键信息展示功能都是插件化的,用户可自行低成本的添加场景来定制化诊断的场景。
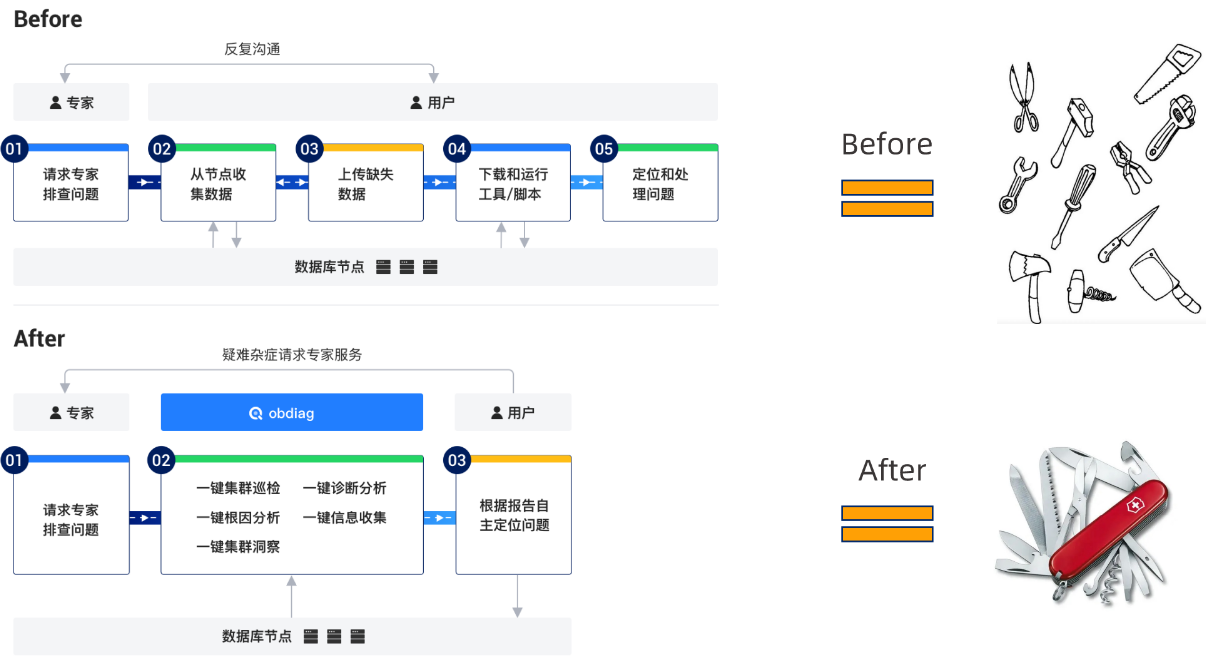
obdiag 价值
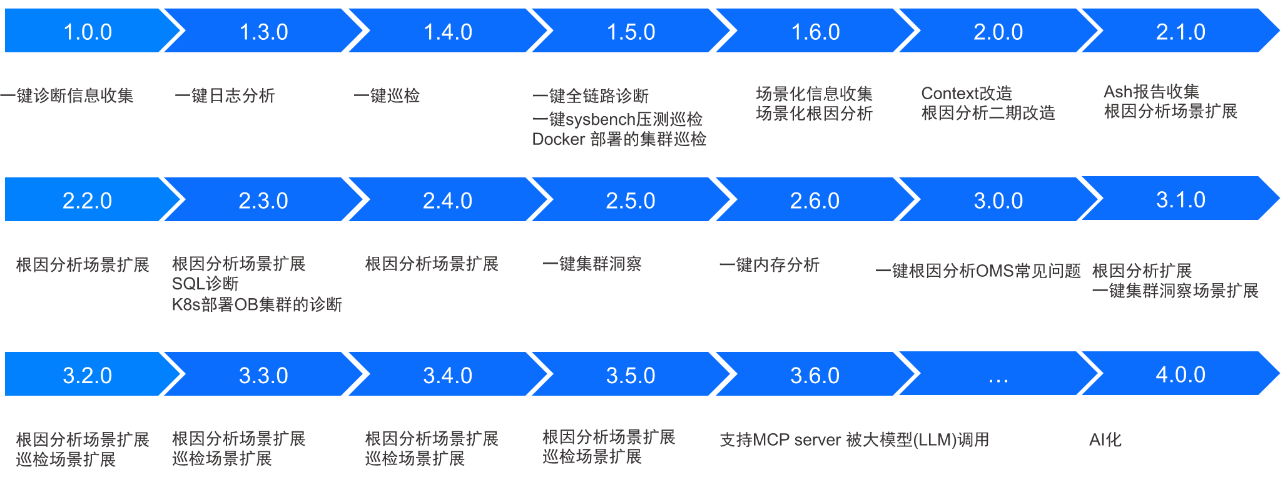
obdiag RoadMap
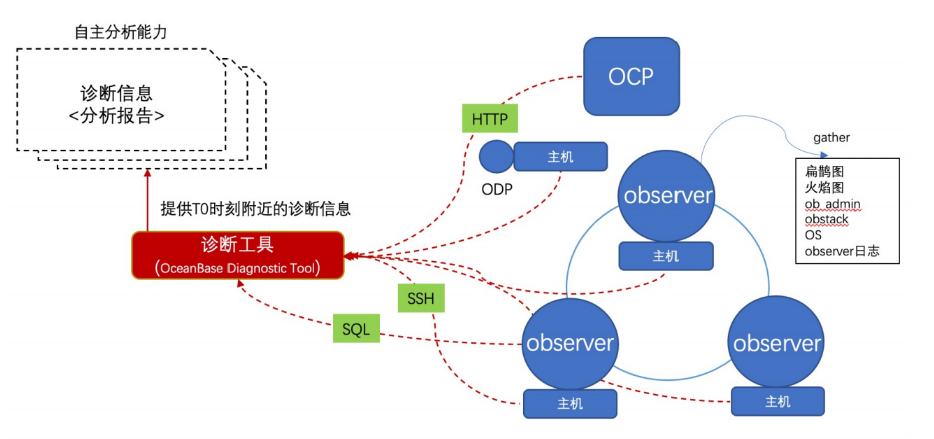
obdiag架构图
敏捷诊断工县obdiag 采用集中式采集将分散在各个节点的信息收集到obdiag所在节点进行统一分析处理。
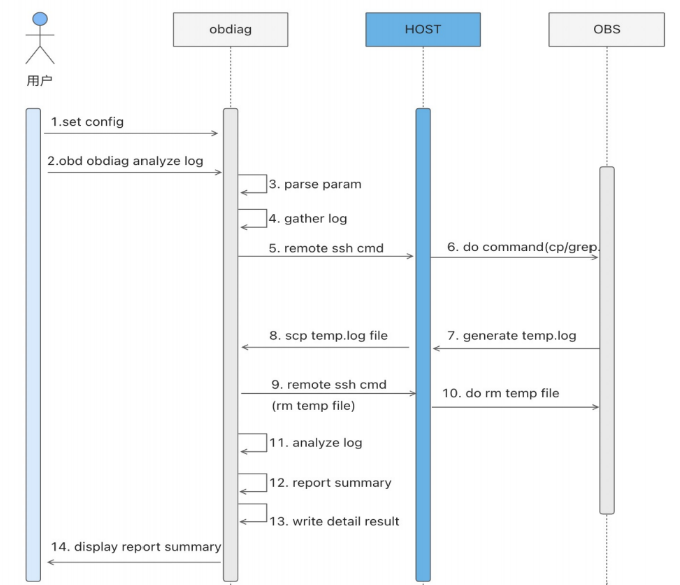
一键诊断时序图
问题排查三板斧
诊断场景更新
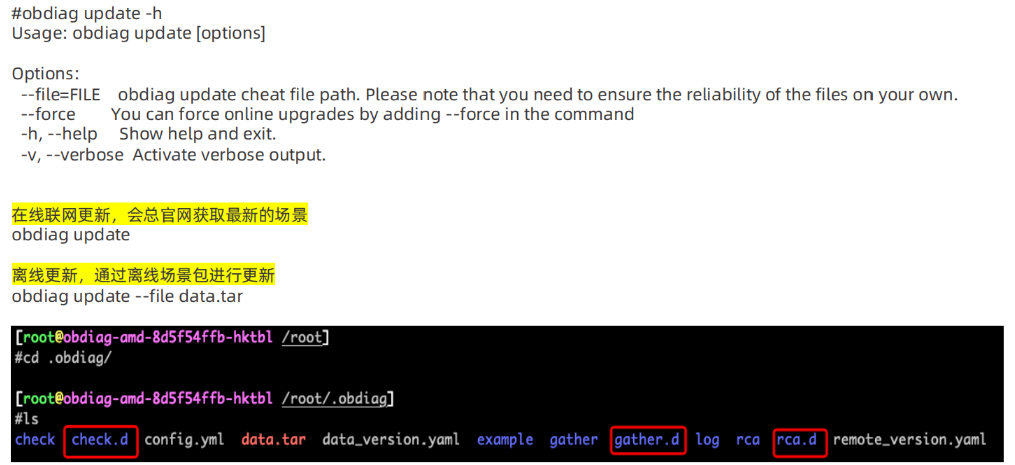
用 户诊断场景更新可能很快,obdiag直接热更新即刻更新场景。
设计&实现
诊断场景自助添加
实验过程
安装配置 obdiag
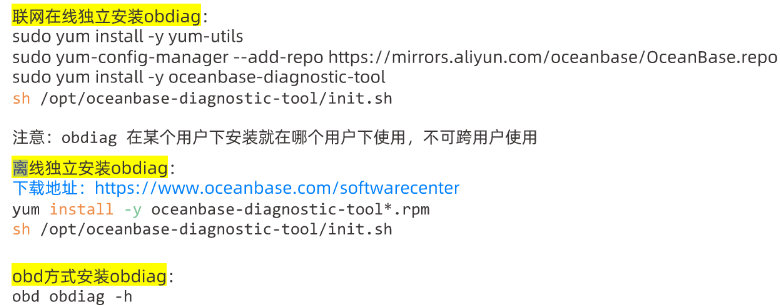
有3种安装方式:联网在线独立安装、离线独立安装、obd方式安装,如下:

安装 obdiag
cd /root
rpm -ivh oceanbase-diagnostic-tool-3.6.0-22025080417.el7.x86_64.rpm
source /opt/oceanbase-diagnostic-tool/init.sh
安装包需要到 下载中心 https://www.oceanbase.com/softwarecenter 进行下载
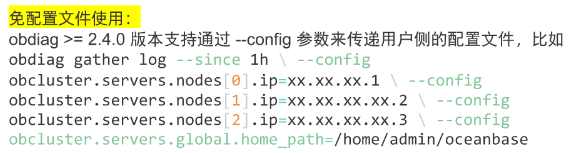
配置 obdiag 用户侧配置文件
配置 obdiag 用户侧配置文件可通过
obdiag config -h <db_host> -u <sys_user> [-p password] [-P port]
命令快速生成或者直接编辑配置文件,文件的默认路径是
~/.obdiag/config.yml
,其样板文件位于
~/.obdiag/example
。即一条命令生成配置文件
obdiag config -h127.0.0.1 -uroot@sys -P2881
交互配置的时候填入信息如下:
username
为root,
home_path
为/home/admin/oceanbase/observer/,obproxy:输入N。其余回车键保持默认即可,输出如下:
[root@iZbp13y46iroifwaco984rZ ~]# obdiag config -h127.0.0.1 -uroot@sys -P2881
obdiag version: 3.6.0
Please enter the following configuration !!!
Enter your oceanbase host ssh username (default:''): root
Enter your use password or key file (0:use password; 1:use key file) default: 0:
Enter your oceanbase host ssh password (default:''):
Enter your oceanbase host ssh_port (default:'22'):
Enter your oceanbase install home_path (default:'/root/observer'): /home/admin/oceanbase/observer/
Enter your need config obproxy [y/N] (default:'N'): N
Node information has been rewritten to the configuration file /root/.obdiag/config.yml, and you can enjoy the journey !
Trace ID: 08065136-767f-11f0-bbc2-00163e30512b
If you want to view detailed obdiag logs, please run: obdiag display-trace 08065136-767f-11f0-bbc2-00163e30512b
如果是生成多个集群配置文件,按以下步骤:

一键集群洞察
使用 obdiag display 命令可帮助洞察 OceanBase 数据库相关的信息。
查看当前支持的场景
obdiag display scene list
场景1: 集群信息洞察
obdiag display scene run --scene=observer.cluster_info
场景2: 集群的节点信息洞察
obdiag display scene run --scene=observer.server_info
场景3: 集群内存信息洞察
obdiag display scene run --scene=observer.memory
场景4: 集群cpu信息洞察
obdiag display scene run --scene=observer.cpu
场景5: 集群topsql信息洞察
obdiag display scene run --scene=observer.topsql --env tenant_name=test --env mtime=10
一键集群巡检
17个大类,120+小类的巡检项
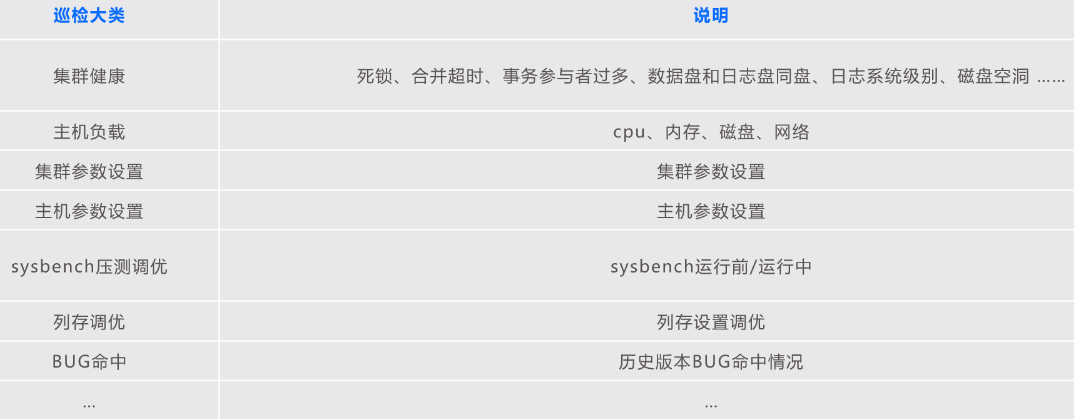
列出所有巡检套餐
--查看所有的巡检套餐
obdiag check list
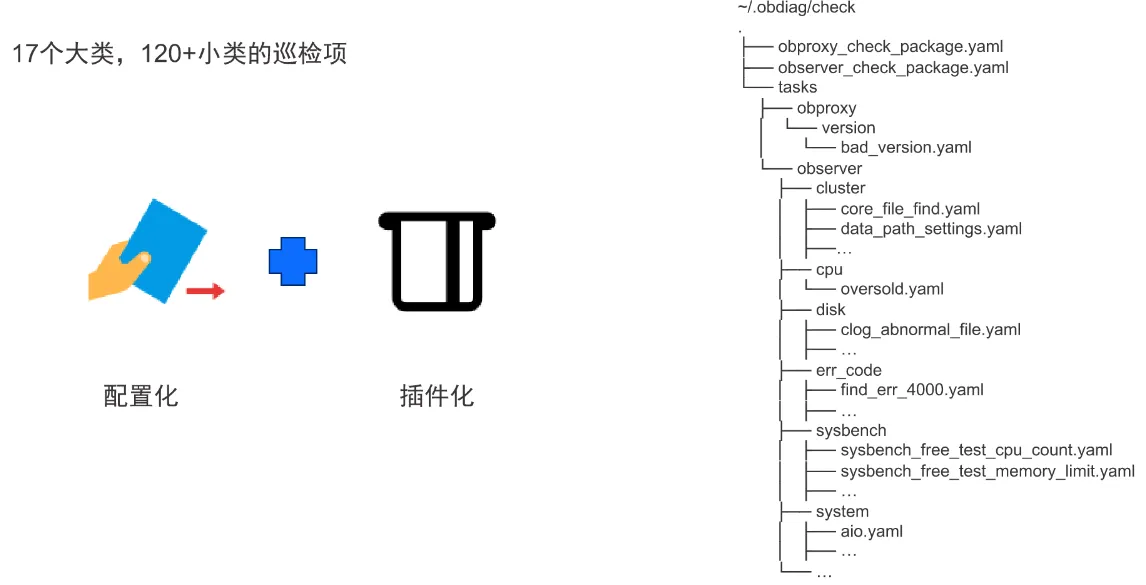
全量巡检 (最常用)
obdiag check run
执行全量巡检之后,会生成一份巡检结果,名为:./check_report/obdiag_check_report_observer_YYYY-MM-HH-MM-xx-xx.table
cat ./check_report/obdiag_check_report_observer*
压测前巡检
obdiag check run cases=sysbench_free
或
obdiag check run cases=sysbench_run
压测进行时巡检
obdiag check run case=sys_run
列出POC巡检
obdiag check run cases=column_storage_poc
一键诊断分析
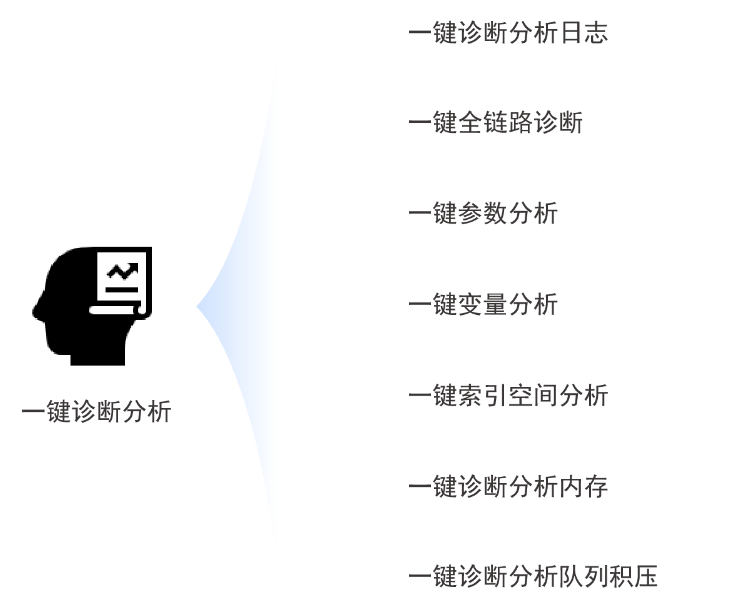
OceanBase 日志分析
--一键日志分析   默认是30分钟
obdiag analyze log
--在线分析最近10分钟的日志,该指令执行的时候会从远程主机上拉取最近10分钟的日志进行分析,诊断出现过的错误
obdiag analyze log  --since 10m
--一键日志分析指定时间区间的日志
obdiag analyze log  --from "2025-8-11 16:05:00" --to "2025-8-11 16:10:00"
--一键离线分析本地文件夹中所有observer的日志
obdiag analyze log  --files /root/obdiag_analyze_pack_20250811162557/
--一键离线分析本地中指定一个文件的日志
obdiag analyze log  --files /root/obdiag_analyze_pack_20250811162557/result_details.txt
OceanBase 内存分析
obdiag analyze memory
一键根因分析
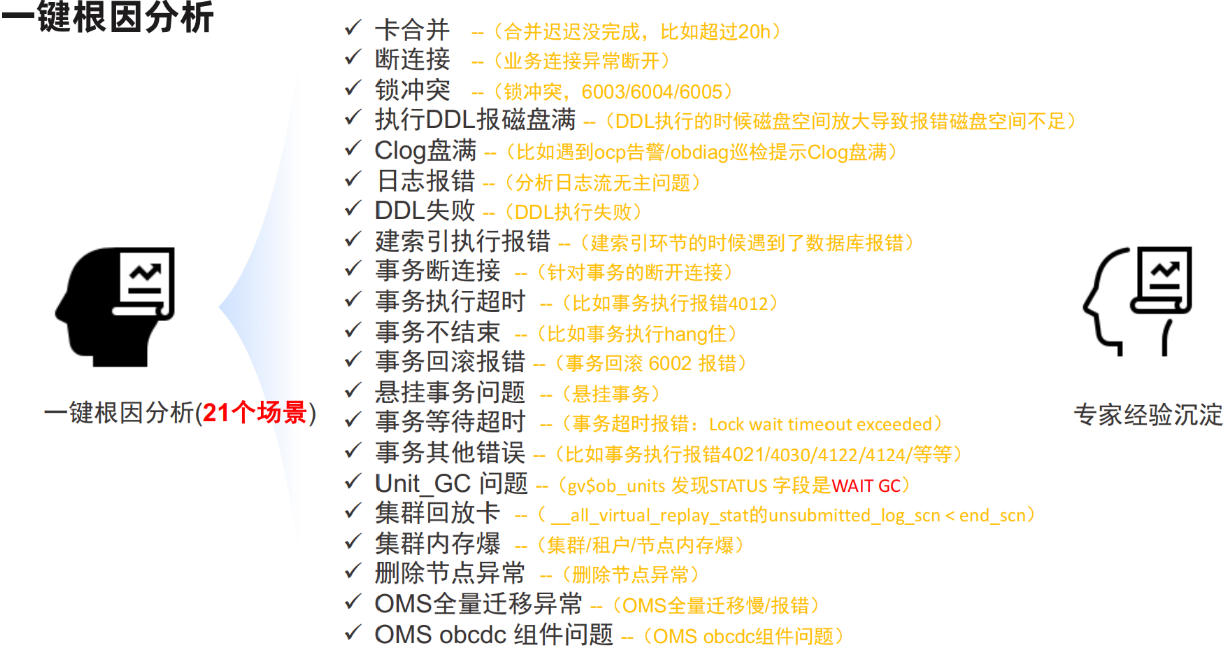
查看已经支持的所有根因分析场景
obdiag rca list
按场景执行根因分分析
obdiag rca run --scene=<scene_name>
scene_name
包含如下:
- disconnection:一键断连诊断,基于 OBProxy 的诊断日志。
- major_hold:一键卡合并诊断。
- lock_conflict:一键锁冲突诊断。
- ddl_disk_full:DDL 过程中报磁盘空间不足的问题诊断。
- ddl_failure:诊断 DDL 失败。
- clog_disk_full: clog 盘满场景根因分析
- log_error: 日志流无主的场景根因分析
- index_ddl_error:建索引报错根因分析
- transaction_disconnection:针对事务断连场景的根因分析。
- log_error:日志相关问题排查。目前支持:无主场景。
- transaction_not_ending:事务不结束场景,目前使用较为复杂。
- transaction_rollback:事务回滚报错。
- transaction_execute_timeout:事务执行超时报错。
- clog_disk_full:clog 日志磁盘空间满的问题。
- transaction_wait_timeout:事务等待超时报错。
- transaction_other_error:事务其他错误,除了目前已经列出的错误,比如错误码为:-4030,-4121,-4122,-4124,-4019。
- suspend_transaction 悬挂事务根因分析。
- index_ddl_error:建索引执行报错问题排查。
- unit_gc:unit GC 问题排查。
- oms_full_trans:OMS 全量迁移异常场景根因分析。
- oms_obcdc: OMS obcdc 组件分析场景根因分析。
场景1: 卡合并根因分析
obdiag rca run --scene=major_hold
参数说明:
major_hold:一键卡合并诊断。
场景2: 所冲突根因分析
obdiag rca run --scene=lock_conflict --env tenant_name=sys
查看根因分析结果
cat ./obdiag_rca/obdiag_major_hold_*/record.table
场景3:断连接分析
obdiag rca run --scene=disconnection
场景4:DDL磁盘满分析
obdiag rca run --scene=ddl_disk_full --env tenant_name=test1 --env table_name=t555 --env action_type=add_index --env index_name=k1 --env database_name=xxx
如果使用OMS相关诊断时(--scene 名字以oms开头)需要配置OMS集群信息,配置文件默认位置:~/.obdiag/config.yml,也可以通过--config 选项传递配置。
一键诊断信息收集
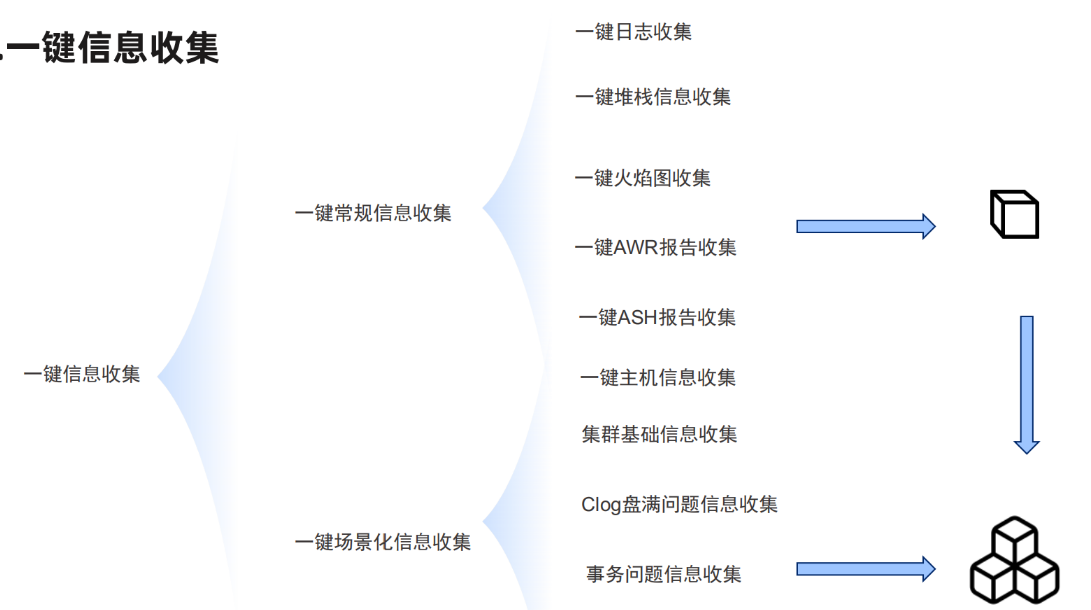
一键诊断信息采集
obdiag gather plan_monitor
常规诊断信息收集
通过
obdiag gather -h
可查看所有的收集功能。
场景1:收集最近一小时的日志
obdiag gather log --since 1h
场景2: 主机信息收集
obdiag gather sysstat
基于场景的信息采集
基于场景的诊断信息收集是上面的常规诊断信息收集的排列组合,用于快速收集具体场景的诊断问题排查所需要的全部信息。
查看当前支持的场景
--查看当前支持的场景
obdiag gather scene list
场景1: 集群基本信息收集
obdiag gather scene run --scene=observer.base
场景2: io问题信息收集
io问题信息收集,默认不需要添加任何参数的话收集最近30分钟的信息
obdiag gather scene run --scene=observer.io
场景3: 内存问题信息收集
内存问题信息收集,默认不需要添加任何参数的话收集最近30分钟的信息
obdiag gather scene run --scene=observer.memory
场景4:火焰图信息采集
obdiag gather perf
来自 “ ITPUB博客 ” ,链接:https://blog.itpub.net/69963491/viewspace-3093206/ ,如需转载,请注明出处,否则将追究法律责任。

