作者:Tatsuya Naganawa 译者:TF编译组
由于GCP允许启动多达5k个节点:),因此vRouter的规模测试程序主要针对该平台来介绍。
- 话虽如此,AWS也可以使用相同的程序
第一个目标是2k个vRouter节点,但是据我尝试,这不是最大值,可以通过更多的控制节点或添加CPU/MEM来达到更大的数值。
在GCP中,可以使用多个子网创建VPC,将控制平面节点分配为172.16.1.0/24,而vRouter节点分配为10.0.0.0/9。(默认子网为/12,最多可达到4k个节点)
默认情况下,并非所有实例都可以具有全局IP,因此需要为vRouter节点定义Cloud NAT才能访问Internet。(我将全局IP分配给控制平面节点,因为节点数量不会那么多)
所有节点均由instance-group创建,并且禁用了auto-scaling,并分配了固定编号。所有节点都为了降低成本而配置了抢占模式(vRouter为$0.01/1hr(n1-standard-1),控制平面节点为$0.64/1hr(n1-standard-64))
总体程序描述如下:
1. 使用此程序设置control/config x 5,analytics x 3,kube-master x 1。
这一步最多需要30分钟。 有更多问题,请与TF中文社区联系。
使用了2002版本。JVM_EXTRA_OPTS:设置为“-Xms128m -Xmx20g”。
需要补充一点的是,XMPP_KEEPALIVE_SECONDS决定了XMPP的可扩展性,我将其设置为3。因此,在vRouter节点故障之后,control组件需要9秒才能识别出它来。(默认情况下设置为10/30)对于IaaS用例,我认为这是一个中等的选择,但如果这个值需要较低,则需要有更多的CPU。
为了后续使用,这里还创建了虚拟网络vn1(10.1.0.0/12,l2/l3)。
2. 使用此程序设置一个kube-master。
这一步最多需要20分钟。 有更多问题,请与TF中文社区联系。
对于cni.yaml,使用以下URL。
XMPP_KEEPALIVE_SECONDS:“3”已经添加到env中。
由于GCP上的vRouter问题,
vrouter-agent容器已打补丁,并且yaml需要更改。

set-label.sh和kubectl apply -f cni.yaml此时已完成。
3. 启动vRouter节点,并使用以下命令转储ips。

这大约需要10-20分钟。
4. 在vRouter节点上安装Kubernetes,然后等待它安装vRouter节点。
(/tmp/aaa.pem is the secret key for GCP)
sudo yum -y install epel-release
sudo yum -y install parallel
sudo su - -c "ulimit -n 8192; su - centos"
cat all.txt | parallel -j3500 scp -i /tmp/aaa.pem -o StrictHostKeyChecking=no install-k8s-packages.sh centos@{}:/tmp
cat all.txt | parallel -j3500 ssh -i /tmp/aaa.pem -o StrictHostKeyChecking=no centos@{} chmod 755 /tmp/install-k8s-packages.sh
cat all.txt | parallel -j3500 ssh -i /tmp/aaa.pem -o StrictHostKeyChecking=no centos@{} sudo /tmp/install-k8s-packages.sh
### this command needs to be up to 200 parallel execution, since without that, it leads to timeout of kubeadm join
cat all.txt | parallel -j200 ssh -i /tmp/aaa.pem -o StrictHostKeyChecking=no centos@{} sudo kubeadm join 172.16.1.x:6443 --token we70in.mvy0yu0hnxb6kxip --discovery-token-ca-cert-hash sha256:13cf52534ab14ee1f4dc561de746e95bc7684f2a0355cb82eebdbd5b1e9f3634
kubeadm加入大约需要20-30分钟。vRouter安装大约需要40-50分钟。(基于Cloud NAT性能,在VPC中添加docker注册表会缩短docker pull time)。
5. 之后,可以使用replica: 2000创建first-containers.yaml,并检查容器之间的ping。要查看BUM行为,vn1也可以与具有2k replica的容器一起使用。
创建容器最多需要15-20分钟。
[config results]
2200 instances are created, and 2188 kube workers are available.
(some are restarted and not available, since those instance are preemptive VM)
[centos@instance-group-1-srwq ~]$ kubectl get node | wc -l
2188
[centos@instance-group-1-srwq ~]$
When vRouters are installed, some more nodes are rebooted, and 2140 vRouters become available.
Every 10.0s: kubectl get pod --all-namespaces | grep contrail | grep Running | wc -l     Sun Feb 16 17:25:16 2020
2140
After start creating 2k containers, 15 minutes is needed before 2k containers are up.
Every 5.0s: kubectl get pod -n myns11 | grep Running | wc -l                                                             Sun Feb 16 17:43:06 2020
1927
ping between containers works fine:
$ kubectl get pod -n myns11
(snip)
vn11-deployment-68565f967b-zxgl4   1/1     Running             0          15m   10.0.6.0     instance-group-3-bqv4   <none>           <none>
vn11-deployment-68565f967b-zz2f8   1/1     Running             0          15m   10.0.6.16    instance-group-2-ffdq   <none>           <none>
vn11-deployment-68565f967b-zz8fk   1/1     Running             0          16m   10.0.1.61    instance-group-4-cpb8   <none>           <none>
vn11-deployment-68565f967b-zzkdk   1/1     Running             0          16m   10.0.2.244   instance-group-3-pkrq   <none>           <none>
vn11-deployment-68565f967b-zzqb7   0/1     ContainerCreating   0          15m   <none>       instance-group-4-f5nw   <none>           <none>
vn11-deployment-68565f967b-zzt52   1/1     Running             0          15m   10.0.5.175   instance-group-3-slkw   <none>           <none>
vn11-deployment-68565f967b-zztd6   1/1     Running             0          15m   10.0.7.154   instance-group-4-skzk   <none>           <none>
[centos@instance-group-1-srwq ~]$ kubectl exec -it -n myns11 vn11-deployment-68565f967b-zzkdk sh
/ #
/ #
/ # ip -o a
1: lo: <LOOPBACK,UP,LOWER_UP> mtu 65536 qdisc noqueue qlen 1000\    link/loopback 00:00:00:00:00:00 brd 00:00:00:00:00:00
1: lo    inet 127.0.0.1/8 scope host lo\       valid_lft forever preferred_lft forever
1: lo    inet6 ::1/128 scope host \       valid_lft forever preferred_lft forever
36: eth0@if37: <BROADCAST,MULTICAST,UP,LOWER_UP,M-DOWN> mtu 1500 qdisc noqueue \    link/ether 02:fd:53:2d:ea:50 brd ff:ff:ff:ff:ff:ff
36: eth0    inet 10.0.2.244/12 scope global eth0\       valid_lft forever preferred_lft forever
36: eth0    inet6 fe80::e416:e7ff:fed3:9cc5/64 scope link \       valid_lft forever preferred_lft forever
/ # ping 10.0.1.61
PING 10.0.1.61 (10.0.1.61): 56 data bytes
64 bytes from 10.0.1.61: seq=0 ttl=64 time=3.635 ms
64 bytes from 10.0.1.61: seq=1 ttl=64 time=0.474 ms
^C
--- 10.0.1.61 ping statistics ---
2 packets transmitted, 2 packets received, 0% packet loss
round-trip min/avg/max = 0.474/2.054/3.635 ms
/ #
There are some XMPP flap .. it might be caused by CPU spike by config-api, or some effect of preemptive VM.
It needs to be investigated further with separating config and control.
(most of other 2k vRouter nodes won't experience XMPP flap though)
(venv) [centos@instance-group-1-h26k ~]$ ./contrail-introspect-cli/ist.py ctr nei -t XMPP -c flap_count | grep -v -w 0
+------------+
| flap_count |
+------------+
| 1          |
| 1          |
| 1          |
| 1          |
| 1          |
| 1          |
| 1          |
| 1          |
| 1          |
| 1          |
| 1          |
| 1          |
| 1          |
| 1          |
+------------+
(venv) [centos@instance-group-1-h26k ~]$
[BUM tree]
Send two multicast packets.
/ # ping 224.0.0.1
PING 224.0.0.1 (224.0.0.1): 56 data bytes
^C
--- 224.0.0.1 ping statistics ---
2 packets transmitted, 0 packets received, 100% packet loss
/ #
/ # ip -o a
1: lo: <LOOPBACK,UP,LOWER_UP> mtu 65536 qdisc noqueue qlen 1000\    link/loopback 00:00:00:00:00:00 brd 00:00:00:00:00:00
1: lo    inet 127.0.0.1/8 scope host lo\       valid_lft forever preferred_lft forever
1: lo    inet6 ::1/128 scope host \       valid_lft forever preferred_lft forever
36: eth0@if37: <BROADCAST,MULTICAST,UP,LOWER_UP,M-DOWN> mtu 1500 qdisc noqueue \    link/ether 02:fd:53:2d:ea:50 brd ff:ff:ff:ff:ff:ff
36: eth0    inet 10.0.2.244/12 scope global eth0\       valid_lft forever preferred_lft forever
36: eth0    inet6 fe80::e416:e7ff:fed3:9cc5/64 scope link \       valid_lft forever preferred_lft forever
/ #
That container is on this node.
(venv) [centos@instance-group-1-h26k ~]$ ping instance-group-3-pkrq
PING instance-group-3-pkrq.asia-northeast1-b.c.stellar-perigee-161412.internal (10.0.3.211) 56(84) bytes of data.
64 bytes from instance-group-3-pkrq.asia-northeast1-b.c.stellar-perigee-161412.internal (10.0.3.211): icmp_seq=1 ttl=63 time=1.46 ms
It sends overlay packet to some other endpoints (not all 2k nodes),
[root@instance-group-3-pkrq ~]# tcpdump -nn -i eth0 udp
tcpdump: verbose output suppressed, use -v or -vv for full protocol decode
listening on eth0, link-type EN10MB (Ethernet), capture size 262144 bytes
17:48:51.501718 IP 10.0.3.211.57333 > 10.0.0.212.6635: UDP, length 142
17:48:52.501900 IP 10.0.3.211.57333 > 10.0.0.212.6635: UDP, length 142
and it eventually reach other containers, going through Edge Replicate tree.
[root@instance-group-4-cpb8 ~]# tcpdump -nn -i eth0 udp
tcpdump: verbose output suppressed, use -v or -vv for full protocol decode
listening on eth0, link-type EN10MB (Ethernet), capture size 262144 bytes
17:48:51.517306 IP 10.0.1.198.58095 > 10.0.5.244.6635: UDP, length 142
17:48:52.504484 IP 10.0.1.198.58095 > 10.0.5.244.6635: UDP, length 142
[resource usage]
controller:
CPU usage is moderate and bound by contrail-control process.
If more vRouter nodes need to be added, more controller nodes can be added.
 - separating config and control also should help to reach further stability
top - 17:45:28 up  2:21,  2 users,  load average: 7.35, 12.16, 16.33
Tasks: 577 total,   1 running, 576 sleeping,   0 stopped,   0 zombie
%Cpu(s): 14.9 us,  4.2 sy,  0.0 ni, 80.8 id,  0.0 wa,  0.0 hi,  0.1 si,  0.0 st
KiB Mem : 24745379+total, 22992752+free, 13091060 used,  4435200 buff/cache
KiB Swap:        0 total,        0 free,        0 used. 23311113+avail Mem
  PID USER      PR  NI    VIRT    RES    SHR S  %CPU %MEM     TIME+ COMMAND
23930 1999      20   0 9871.3m   5.5g  14896 S  1013  2.3   1029:04 contrail-contro
23998 1999      20   0 5778768 317660  12364 S 289.1  0.1 320:18.42 contrail-dns
13434 polkitd   20   0   33.6g 163288   4968 S   3.3  0.1  32:04.85 beam.smp
26696 1999      20   0  829768 184940   6628 S   2.3  0.1   0:22.14 node
 9838 polkitd   20   0   25.4g   2.1g  15276 S   1.3  0.9  45:18.75 java
 1012 root      20   0       0      0      0 S   0.3  0.0   0:00.26 kworker/18:1
 6293 root      20   0 3388824  50576  12600 S   0.3  0.0   0:34.39 docker-containe
 9912 centos    20   0   38.0g 417304  12572 S   0.3  0.2   0:25.30 java
16621 1999      20   0  735328 377212   7252 S   0.3  0.2  23:27.40 contrail-api
22289 root      20   0       0      0      0 S   0.3  0.0   0:00.04 kworker/16:2
24024 root      20   0  259648  41992   5064 S   0.3  0.0   0:28.81 contrail-nodemg
48459 centos    20   0  160328   2708   1536 R   0.3  0.0   0:00.33 top
61029 root      20   0       0      0      0 S   0.3  0.0   0:00.09 kworker/4:2
    1 root      20   0  193680   6780   4180 S   0.0  0.0   0:02.86 systemd
    2 root      20   0       0      0      0 S   0.0  0.0   0:00.03 kthreadd
[centos@instance-group-1-rc34 ~]$ free -h
              total        used        free      shared  buff/cache   available
Mem:           235G         12G        219G        9.8M        3.9G        222G
Swap:            0B          0B          0B
[centos@instance-group-1-rc34 ~]$
[centos@instance-group-1-rc34 ~]$ df -h .
/dev/sda1         10G  5.1G  5.0G   51% /
[centos@instance-group-1-rc34 ~]$

analytics:
CPU usage is moderate and bound by contrail-collector process.
If more vRouter nodes need to be added, more analytics nodes can be added.
top - 17:45:59 up  2:21,  1 user,  load average: 0.84, 2.57, 4.24
Tasks: 515 total,   1 running, 514 sleeping,   0 stopped,   0 zombie
%Cpu(s):  3.3 us,  1.3 sy,  0.0 ni, 95.4 id,  0.0 wa,  0.0 hi,  0.0 si,  0.0 st
KiB Mem : 24745379+total, 24193969+free,  3741324 used,  1772760 buff/cache
KiB Swap:        0 total,        0 free,        0 used. 24246134+avail Mem
  PID USER      PR  NI    VIRT    RES    SHR S  %CPU %MEM     TIME+ COMMAND
 6334 1999      20   0 7604200 958288  10860 S 327.8  0.4 493:31.11 contrail-collec
 4904 polkitd   20   0  297424 271444   1676 S  14.6  0.1  10:42.34 redis-server
 4110 root      20   0 3462120  95156  34660 S   1.0  0.0   1:21.32 dockerd
    9 root      20   0       0      0      0 S   0.3  0.0   0:04.81 rcu_sched
   29 root      20   0       0      0      0 S   0.3  0.0   0:00.05 ksoftirqd/4
 8553 centos    20   0  160308   2608   1536 R   0.3  0.0   0:00.07 top
    1 root      20   0  193564   6656   4180 S   0.0  0.0   0:02.77 systemd
    2 root      20   0       0      0      0 S   0.0  0.0   0:00.03 kthreadd
    4 root       0 -20       0      0      0 S   0.0  0.0   0:00.00 kworker/0:0H
    5 root      20   0       0      0      0 S   0.0  0.0   0:00.77 kworker/u128:0
    6 root      20   0       0      0      0 S   0.0  0.0   0:00.17 ksoftirqd/0
    7 root      rt   0       0      0      0 S   0.0  0.0   0:00.38 migration/0
[centos@instance-group-1-n4c7 ~]$ free -h
              total        used        free      shared  buff/cache   available
Mem:           235G        3.6G        230G        8.9M        1.7G        231G
Swap:            0B          0B          0B
[centos@instance-group-1-n4c7 ~]$
[centos@instance-group-1-n4c7 ~]$ df -h .
/dev/sda1         10G  3.1G  6.9G   32% /
[centos@instance-group-1-n4c7 ~]$
kube-master:
CPU usage is small.
top - 17:46:18 up  2:22,  2 users,  load average: 0.92, 1.32, 2.08
Tasks: 556 total,   1 running, 555 sleeping,   0 stopped,   0 zombie
%Cpu(s):  1.2 us,  0.5 sy,  0.0 ni, 98.2 id,  0.1 wa,  0.0 hi,  0.1 si,  0.0 st
KiB Mem : 24745379+total, 23662128+free,  7557744 used,  3274752 buff/cache
KiB Swap:        0 total,        0 free,        0 used. 23852964+avail Mem
  PID USER      PR  NI    VIRT    RES    SHR S  %CPU %MEM     TIME+ COMMAND
 5177 root      20   0 3605852   3.1g  41800 S  78.1  1.3 198:42.92 kube-apiserver
 5222 root      20   0   10.3g 633316 410812 S  55.0  0.3 109:52.52 etcd
 5198 root      20   0  846948 651668  31284 S   8.3  0.3 169:03.71 kube-controller
 5549 root      20   0 4753664  96528  34260 S   5.0  0.0   4:45.54 kubelet
 3493 root      20   0 4759508  71864  16040 S   0.7  0.0   1:52.67 dockerd-current
 5197 root      20   0  500800 307056  17724 S   0.7  0.1   6:43.91 kube-scheduler
19933 centos    20   0  160340   2648   1528 R   0.7  0.0   0:00.07 top
 1083 root       0 -20       0      0      0 S   0.3  0.0   0:20.19 kworker/0:1H
35229 root      20   0       0      0      0 S   0.3  0.0   0:15.08 kworker/0:2
    1 root      20   0  193808   6884   4212 S   0.0  0.0   0:03.59 systemd
    2 root      20   0       0      0      0 S   0.0  0.0   0:00.03 kthreadd
    4 root       0 -20       0      0      0 S   0.0  0.0   0:00.00 kworker/0:0H
    5 root      20   0       0      0      0 S   0.0  0.0   0:00.55 kworker/u128:0
    6 root      20   0       0      0      0 S   0.0  0.0   0:01.51 ksoftirqd/0
[centos@instance-group-1-srwq ~]$ free -h
              total        used        free      shared  buff/cache   available
Mem:           235G         15G        217G        121M        3.2G        219G
Swap:            0B          0B          0B
[centos@instance-group-1-srwq ~]$
[centos@instance-group-1-srwq ~]$ df -h /
/dev/sda1         10G  4.6G  5.5G   46% /
[centos@instance-group-1-srwq ~]$
[centos@instance-group-1-srwq ~]$ free -h
              total        used        free      shared  buff/cache   available
Mem:           235G         15G        217G        121M        3.2G        219G
Swap:            0B          0B          0B
[centos@instance-group-1-srwq ~]$
[centos@instance-group-1-srwq ~]$ df -h /
/dev/sda1         10G  4.6G  5.5G   46% /
[centos@instance-group-1-srwq ~]$
附:erm-vpn
启用erm-vpn后,vrouter会将多播流量发送到最多4个节点上,以避免入口(ingress)复制到所有节点。控制器以生成树的方式,将多播数据包发送到所有节点。
为了说明此功能,我创建了一个具有20个kubernete worker的集群,并部署了20个副本。
- 没有使用default-k8s-pod-network,因为它是仅支持l3转发的模式。这里手动定义了vn1(10.0.1.0/24)
在此设置中,以下的命令将转储下一跳(下一跳将发送overlay BUM流量)。
- vrf 2在每个worker节点上都有vn1的路由
- all.txt上具有20个节点的IP
- 当BUM数据包从“ Introspect Host”上的容器发送时,它们以单播overlay的方式发送到“dip”地址
[root@ip-172-31-12-135 ~]# for i in $(cat all.txt); do ./contrail-introspect-cli/ist.py --host $i vr route -v 2 --family layer2 ff:ff:ff:ff:ff:ff -r | grep -w -e dip -e Introspect | sort -r | uniq ; done
Introspect Host: 172.31.15.27
                  dip: 172.31.7.18
Introspect Host: 172.31.4.249
                  dip: 172.31.9.151
                  dip: 172.31.9.108
                  dip: 172.31.8.233
                  dip: 172.31.2.127
                  dip: 172.31.10.233
Introspect Host: 172.31.14.220
                  dip: 172.31.7.6
Introspect Host: 172.31.8.219
                  dip: 172.31.3.56
Introspect Host: 172.31.7.223
                  dip: 172.31.3.56
Introspect Host: 172.31.2.127
                  dip: 172.31.7.6
                  dip: 172.31.7.18
                  dip: 172.31.4.249
                  dip: 172.31.3.56
Introspect Host: 172.31.14.255
                  dip: 172.31.7.6
Introspect Host: 172.31.7.6
                  dip: 172.31.2.127
                  dip: 172.31.14.255
                  dip: 172.31.14.220
                  dip: 172.31.13.115
                  dip: 172.31.11.208
Introspect Host: 172.31.10.233
                  dip: 172.31.4.249
Introspect Host: 172.31.15.232
                  dip: 172.31.7.18
Introspect Host: 172.31.9.108
                  dip: 172.31.4.249
Introspect Host: 172.31.8.233
                  dip: 172.31.4.249
Introspect Host: 172.31.8.206
                  dip: 172.31.3.56
Introspect Host: 172.31.7.142
                  dip: 172.31.3.56
Introspect Host: 172.31.15.210
                  dip: 172.31.7.18
Introspect Host: 172.31.11.208
                  dip: 172.31.7.6
Introspect Host: 172.31.13.115
                  dip: 172.31.9.151
Introspect Host: 172.31.7.18
                  dip: 172.31.2.127
                  dip: 172.31.15.27
                  dip: 172.31.15.232
                  dip: 172.31.15.210
Introspect Host: 172.31.3.56
                  dip: 172.31.8.219
                  dip: 172.31.8.206
                  dip: 172.31.7.223
                  dip: 172.31.7.142
                  dip: 172.31.2.127
Introspect Host: 172.31.9.151
                  dip: 172.31.13.115
[root@ip-172-31-12-135 ~]#
举例来说,我尝试从worker 172.31.7.18上的一个容器向一个多播地址($ ping 224.0.0.1)发送ping信息,它向dip列表中的计算节点发送了4个数据包。
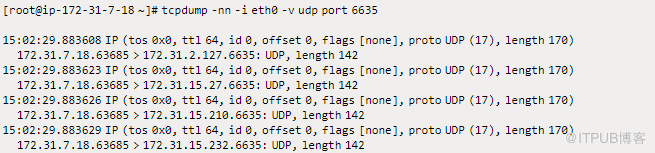
未定义为直接下一跳的其它节点(172.31.7.223)也接收了多播数据包,尽管它的延迟有所增加。
- 在这种情况下,需要额外增加2个跃点:172.31.7.18-> 172.31.2.127-> 172.31.3.56-> 172.31.7.223



来自 “ ITPUB博客 ” ,链接:https://blog.itpub.net/69957171/viewspace-2720698/ ,如需转载,请注明出处,否则将追究法律责任。

