
python直方图显示值的方法:
可以使用text()函数通过为直方图添加注释的方法来显示值。
函数功能:添加图形内容细节的无指向型注释文本
函数语法:
plt.text(x, y, string, weight="bold", color="b")
参数说明:
x: 注释文本内容所在位置的横坐标
y:注释文本内容所在位置的纵坐标
string:注释文本内容
weight:注释文本内容的粗细风格
color:注释文本内容的字体颜色
# -*- coding: utf-8 -*-

import matplotlib.pyplot as plt

#num_list = [1.5,0.6,7.8,6]
fig, ax = plt.subplots()
num_list = [7870,81937,17529598,6225227]
name_list = ['Eviction','Failed','Finished','Killed']
b = ax.bar(name_list, num_list)

plt.bar(range(len(num_list)), num_list,color='rbg',tick_label=name_list)

for a, b in zip(name_list, num_list):
    ax.text(a, b+1, b, ha='center', va='bottom')

plt.title('Numbers of Four eventtypes')
plt.xlabel('Eventtype')
plt.ylabel('Number')
plt.show()
效果如下:
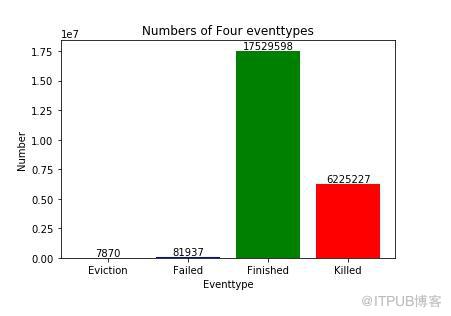
更多Python知识请关注Python自学网。
来自 “ ITPUB博客 ” ,链接:https://blog.itpub.net/615/viewspace-2833489/ ,如需转载,请注明出处,否则将追究法律责任。
上一篇:
mysql怎么添加汉字
下一篇:
postgresql不能关闭怎么办

请登录后发表评论
登录
全部评论
