绘图是数据可视化最直接的方法,也是直观分析数据所必不可少的步骤。Matplotlib是Python中专门用于数据可视化的第三方库,也是最为流行的绘图库。Matplotlib库中的annotate()函数主要用于在图表中给数据添加标注文字,比如量化交易专栏中在图表上用annotate标注了跳空缺口、买卖点等信息,如下所示:
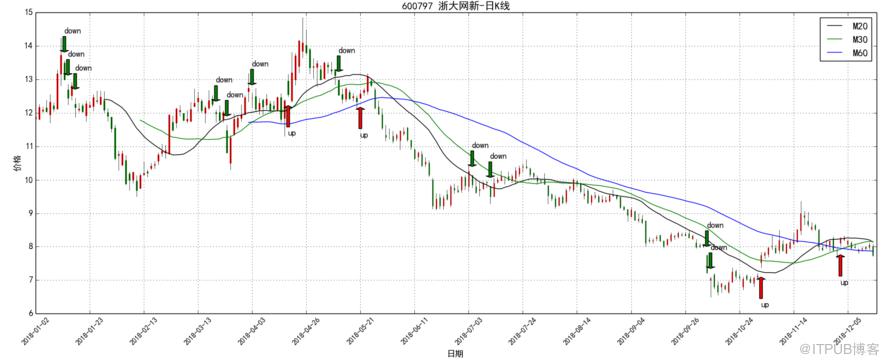
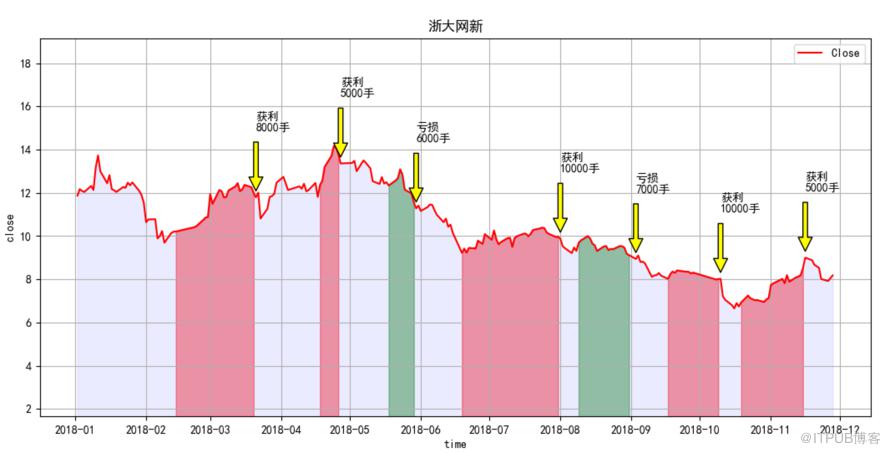
其实annotate()函数可以绘制出更丰富的箭头形态,接下来本文用例程方式对annotate()函数进行更详细的介绍。
Annotate的构造函数为 :Annotation(s, xy, xytext=None, xycoords=‘data’, textcoords=None, arrowprops=None, annotation_clip=None, **kwargs)
介绍下其中的几个关键参数:
- s 为注释文本内容
- xy 为被注释的坐标点,二维元组形如(x,y)
- xytext 为注释文本的坐标点,也是二维元组,默认与xy相同
- xycoords为被注释点的坐标系属性
- textcoords 设置注释文本的坐标系属性
通常xycoords值为’data’,即以被注释的坐标点xy为参考,textcoords 选择为相对于被注释点xy的偏移量,‘offset points’或者’offset pixels’。
示例代码如下所示:
plt.figure(figsize=(12, 6), dpi=100, facecolor="white")

x = np.arange(10, 18)
y = np.around(np.log(x),2)

plt.plot(x, y, marker='o')

for xy in zip(x, y):
    plt.annotate("(%s,%s)" % xy, xy=xy, xytext=(-20, 5), textcoords='offset points')

plt.show()
显示效果如下所示: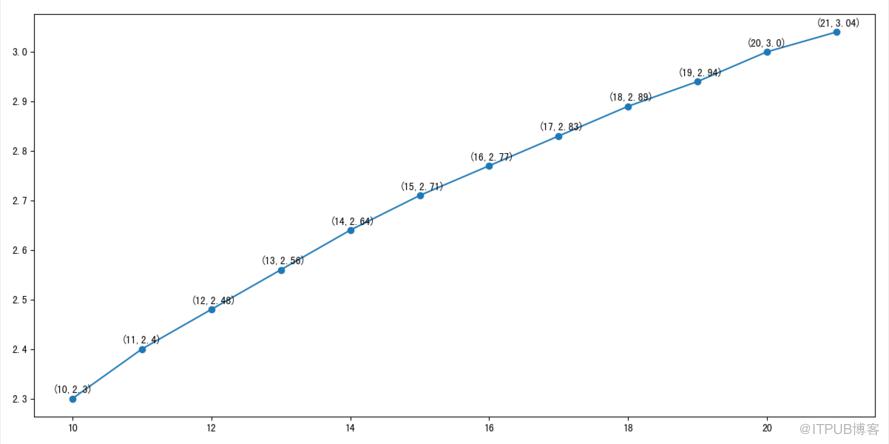
- arrowprops为箭头的样式,dict(字典)型数据,如果该属性非空,则会在注释文本和被注释点之间画一个箭头。如果不设置’arrowstyle’关键字,则允许包含关键字width、headwidth、headlength、shrink
如果设置了箭头的样式‘arrowstyle’关键字,以上关键字就不能使用。允许的值有:
- ‘-’ None
- ‘->’ head_length=0.4,head_width=0.2
- ‘-[’ widthB=1.0,lengthB=0.2,angleB=None
- ‘|-|’ widthA=1.0,widthB=1.0
- ‘-|>’ head_length=0.4,head_width=0.2
- ‘<-’ head_length=0.4,head_width=0.2
- ‘<->’ head_length=0.4,head_width=0.2
- ‘<|-’ head_length=0.4,head_width=0.2
- ‘<|-|>’ head_length=0.4,head_width=0.2
- ‘fancy’ head_length=0.4,head_width=0.4,tail_width=0.4
- ‘simple’ head_length=0.5,head_width=0.5,tail_width=0.2
- ‘wedge’ tail_width=0.3,shrink_factor=0.5
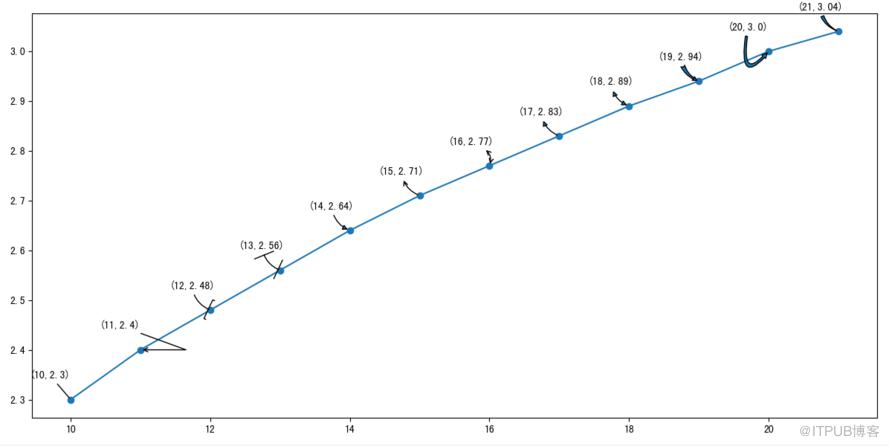
箭头连接了xy和xytext这两个点,connectionstyle键值可控制两个点之间的连接路径。
接下来我们用一个例程来查看下这些箭头样式的实际效果。
示例代码如下所示:
arrow_style = ['-','->','-[','|-|','-|>','<-','<->','<|-','<|-|>','fancy','simple','wedge']
connection_style = ["arc,rad=0.3", "angle,angleA=-20", "arc3,rad=0.3", "arc3,rad=0.3",
                    "arc3,rad=0.3", "arc3,rad=0.3", "angle3,angleA=-20,angleB=70",
                    "arc3,rad=0.3","arc3,rad=0.3","arc3,rad=0.3", "angle3,angleA=80,angleB=50",
                    "arc3,rad=0.3"]
for index, xy in enumerate(zip(x, y)):
    plt.annotate("(%s,%s)" % xy, xy=xy, xytext=(-40, 20),
                 textcoords='offset points',
                 arrowprops=dict(arrowstyle=arrow_style[index],connectionstyle=connection_style[index]))
显示效果如下所示:
- bbox参数可以在文本周围增加外框,常用参数如下:
- boxstyle方框外形,参数是框样式的名称与其作为关键字参数的属性
- facecolor(简写fc)背景颜色
- edgecolor(简写ec)边框线条颜色
- edgewidth边框线条大小
接下来我们用一个例程来查看下这些箭头样式的未添加方框和添加方框后的实际效果。
示例代码如下所示:
plt.annotate('annotate', xy=(10, 2.5), xytext=(50, 20), textcoords='offset points',
            arrowprops=dict(facecolor='black', shrink=0.05, width=5))
plt.annotate('annotate', xy=(13, 2.5), xytext=(50, 20), textcoords='offset points',
            arrowprops=dict(facecolor='green', headwidth=5, headlength=10),
            bbox=dict(boxstyle='circle,pad=0.5', fc='yellow', ec='k', lw=1,alpha=0.5)) # fc为facecolor,ec为edgecolor,lw为lineweight
plt.annotate('annotate', xy=(16, 2.5), xytext=(50, 20), textcoords='offset points',
            arrowprops=dict(facecolor='red', shrinkA=5, shrinkB=10))
plt.annotate('annotate', xy=(19, 2.5), xytext=(50, 20), textcoords='offset points',
            arrowprops=dict(facecolor='blue', headwidth=5, headlength=10),
            bbox=dict(boxstyle='round,pad=0.5', fc='gray', ec='k', lw=1,alpha=0.5))
显示效果如下所示: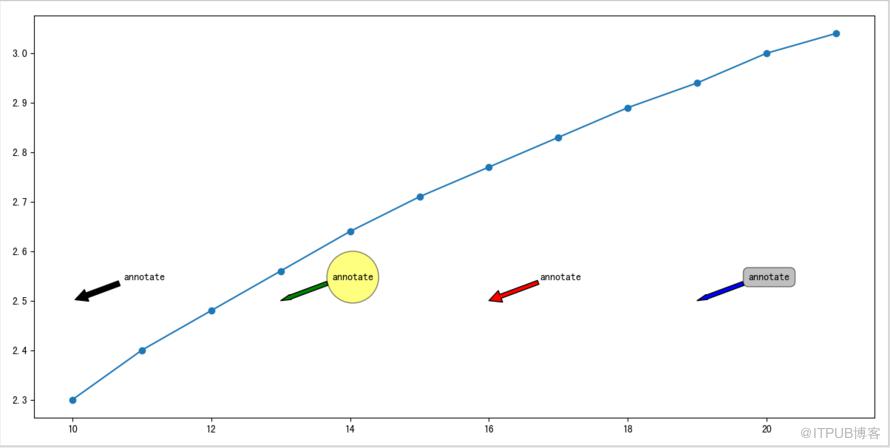
来自 “ ITPUB博客 ” ,链接:https://blog.itpub.net/4715/viewspace-2824241/ ,如需转载,请注明出处,否则将追究法律责任。

