带触控的图表类,后期会把这个功能类,添加到这个框架里我自己写的一套android开发框架,有兴趣的可以下载下来看,这个框架会经常更新:
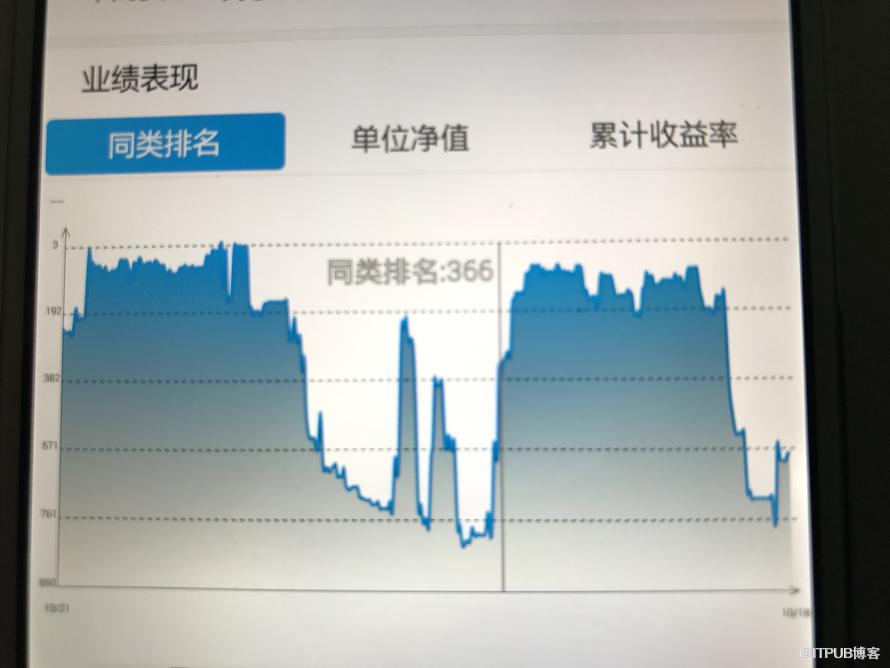
效果如下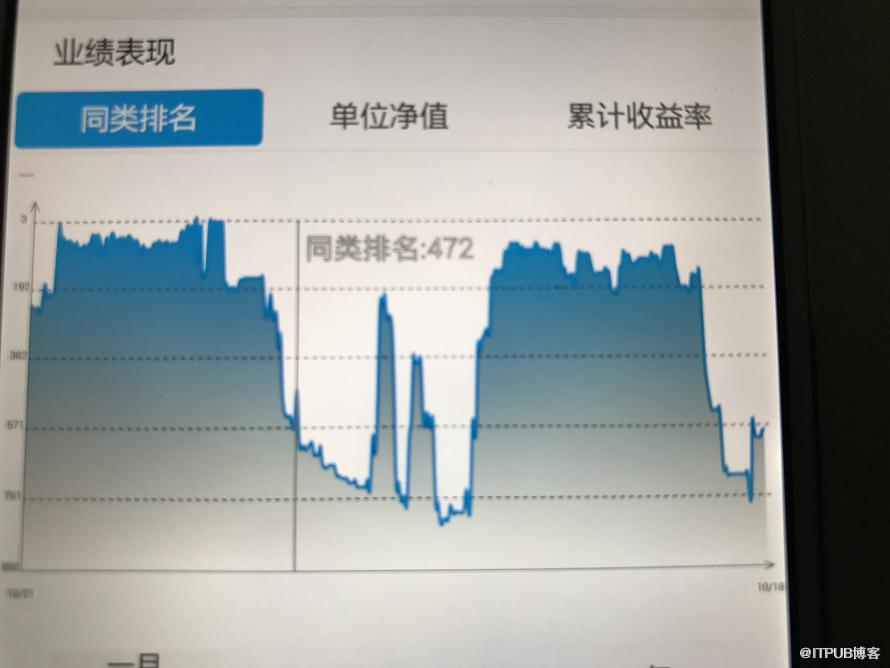
public class BaseFundChartView extends View implements View.OnTouchListener{

    Paint linePaint;
    Paint textPaint;
    Paint xyChartPaint;
    Paint chartLinePaint;
    Paint chartJianbianPaint;
    Paint huodongPaint;
    Paint huodongPaintText;
    List points;
    public BaseFundChartView(Context context, AttributeSet attrs, int defStyleAttr) {
        super(context, attrs, defStyleAttr);
        init();
    }

    public BaseFundChartView(Context context) {
        this(context, null);
    }

    public BaseFundChartView(Context context, AttributeSet attrs) {
        this(context, attrs, 0);
    }

    PathEffect effect;
    Path path;

    private float getWidthYMax(){
        return getWidth()-15;
    }

    private void init() {
        linePaint = new Paint();
        textPaint = new Paint();
        xyChartPaint = new Paint();
        chartLinePaint = new Paint();
        chartJianbianPaint = new Paint();
        huodongPaint = new Paint();
        huodongPaintText = new Paint();
        //设置绘制模式为-虚线作为背景线。
        effect = new DashPathEffect(new float[] { 6, 6, 6, 6, 6}, 2);
        //背景虚线路径.
        path = new Path();
        //只是绘制的XY轴
        linePaint.setStyle(Paint.Style.STROKE);
//        linePaint.setStrokeWidth((float) 0.7);
        linePaint.setStrokeWidth((float) 1.0);             //设置线宽

        linePaint.setColor(Color.BLACK);
        linePaint.setAntiAlias(true);// 锯齿不显示

        //XY刻度上的字
        textPaint.setStyle(Paint.Style.FILL);// 设置非填充
        textPaint.setStrokeWidth(1);// 笔宽5像素
        textPaint.setColor(Color.BLACK);// 设置为蓝笔
        textPaint.setAntiAlias(true);// 锯齿不显示
        textPaint.setTextAlign(Paint.Align.CENTER);
        textPaint.setTextSize(15);

        //绘制XY轴上的字:Y开关状态、X时间
        xyChartPaint.setStyle(Paint.Style.FILL);
        xyChartPaint.setStrokeWidth(1);
        xyChartPaint.setColor(Color.BLUE);
        xyChartPaint.setAntiAlias(true);
        xyChartPaint.setTextAlign(Paint.Align.CENTER);
        xyChartPaint.setTextSize(18);
        //绘制的折线
        chartLinePaint.setStyle(Paint.Style.STROKE);
        chartLinePaint.setStrokeWidth(5);
        chartLinePaint.setColor(Color.BLUE);
        chartLinePaint.setAntiAlias(true);

        //绘制的折线
        chartJianbianPaint.setStyle(Paint.Style.FILL);
        chartJianbianPaint.setStrokeWidth(5);
        //chartJianbianPaint.setColor(Color.YELLOW);

        chartJianbianPaint.setAntiAlias(true);

        huodongPaint.setStyle(Paint.Style.STROKE);
        huodongPaint.setStrokeWidth((float) 3.0);             //设置线宽

        huodongPaint.setColor(Color.GRAY);
        huodongPaint.setAntiAlias(true);// 锯齿不显示

        huodongPaintText.setStyle(Paint.Style.STROKE);
        huodongPaintText.setStrokeWidth((float) 2.0);             //设置线宽
        huodongPaintText.setTextSize(40);
        huodongPaintText.setColor(Color.GRAY);
        huodongPaintText.setAntiAlias(true);// 锯齿不显示

        setOnTouchListener(this);
    }

    /**
     * 重要参数,两点之间分为几段描画,数字愈大分段越多,描画的曲线就越精细.
     */
    private static final int STEPS = 12;

    float gridX,gridY,xSpace = 0,ySpace = 0,spaceYT = 0;
    Float yStart=null,yStop = null;
    Integer yCount = null;

    List text = null;

    public void setText(List text) {
        this.text = text;
    }

    public void setyCount(Integer yCount) {
        this.yCount = yCount;
    }

    public void setyStart(Float yStart) {
        this.yStart = yStart;
    }

    public void setyStop(Float yStop) {
        this.yStop = yStop;
    }

    String yFormat=null;

    public void setFormat(String yFormat){
        this.yFormat = yFormat;
    }

    List dateX = null;
    List dateY = null;

    List> data = null;

    List colors = null;

    public void setColors(List colors) {
        this.colors = colors;
    }

    public List getDateY() {
        return dateY;
    }

    public void setDateY(List dateY) {
        this.dateY = dateY;
    }

    public List> getData() {
        return data;
    }

    public void setData(List> data) {
        this.data = data;
    }

    public List getDateX() {
        return dateX;
    }

    public void setDateX(List dateX) {
        this.dateX = dateX;
    }

    @Override
    protected void onDraw(Canvas canvas) {
        super.onDraw(canvas);

        //基准点。
        gridX = 40;
        gridY = getHeight() - 50;
        //XY间隔。
        if(dateX!=null&&dateX.size()>0){
            xSpace = (getWidthYMax() - gridX)/dateX.size();
        }
        /**
         * 如果设置开头和结尾的话,就直接生成y轴
         */
        if(yStart!=null&&yStop!=null&&yCount!=null){
            dateY = new ArrayList();
            ySpace = (gridY - 70)/yCount;
            float ze = (yStop-yStart)/yCount;
            for(int i=0;i2){
                spaceYT = dateY.get(1)-dateY.get(0);
            }
        }else{
            if(dateY!=null&&dateY.size()>0){
                ySpace = (gridY - 70)/dateY.size();
                yStart = dateY.get(0);
                if(dateY.size()>2){
                    spaceYT = dateY.get(1)-dateY.get(0);
                }
            }
        }

        UIUtils.log("rewqfdesa",gridY,"fdsafdsa");

        //画Y轴(带箭头)。
        canvas.drawLine(gridX, gridY - 20 - 10, gridX,  10, linePaint);
        canvas.drawLine(gridX,  10, gridX - 6, 14 + 10, linePaint);//Y轴箭头。
        canvas.drawLine(gridX,  10, gridX + 6, 14 + 10, linePaint);

        //画Y轴名字。
        //由于是竖直显示的,先以原点顺时针旋转90度后为新的坐标系
        //canvas.rotate(-90);
        //当xyChartPaint的setTextAlign()设置为center时第二、三个参数代表这四个字中点所在的xy坐标

        //canvas.drawText("开关状态", -((float) (getHeight() - 60) - 15 - 5 - 1 / ((float) 1.6 * 1) * (getHeight() - 60) / 2), gridX - 15, xyChartPaint);
        //绘制Y轴坐标

        //canvas.rotate(90); //改变了坐标系还要再改过来
        float y = 0;
        //画X轴。
        y = gridY - 20;
        canvas.drawLine(gridX, y - 10, getWidthYMax(), y - 10, linePaint);//X轴.
        canvas.drawLine(getWidthYMax(), y - 10, getWidthYMax() - 14, y - 6 - 10, linePaint);//X轴箭头。
        canvas.drawLine(getWidthYMax(), y - 10, getWidthYMax() - 14, y + 6 - 10, linePaint);

        //绘制X刻度坐标。
        float x = 0;
        if(dateX!=null){
            for (int n = 0; n 0){
            float lastPointX = 0; //前一个点
            float lastPointY = 0;
            float currentPointX = 0;//当前点
            float currentPointY = 0;
            for(int n=0;n da = data.get(n);
                List da_x = new ArrayList();
                List da_y = new ArrayList();
                /**
                 * 曲线路劲
                 */
                Path curvePath = new Path();
                /**
                 * 渐变色路径
                 */
                Path jianBianPath = new Path();

                for(int m=0;m0){
//                        canvas.drawLine(lastPointX, lastPointY, currentPointX, currentPointY, chartLinePaint);
//                    }
//                    lastPointX = currentPointX;
//                    lastPointY = currentPointY;
                }
                List calculate_y = calculate(da_y);
                List calculate_x = calculate(da_x);
                curvePath.moveTo(calculate_x.get(0).eval(0), calculate_y.get(0).eval(0));
                jianBianPath.moveTo(gridX,gridY - 20 - 10);
                jianBianPath.lineTo(calculate_x.get(0).eval(0), calculate_y.get(0).eval(0));
                chartLinePaint.setColor(colors.get(n));
                float lastx = 0;
                for (int i = 0; i 0){
                Paint.FontMetrics metrics = huodongPaintText.getFontMetrics();
                float top = metrics.top;
                float bootom = metrics.bottom;
                float h = bootom-top;
                float th = h + h*text.size();
                float w=0;
                float fx = 1;
                if(lineX>getWidth()/2){
                    fx = -1;
                }else{
                    fx = 1;
                }
                for(int i=0;iw){
                        w = width;
                    }
                    canvas.drawText(text.get(i),fx==1?lineX+10:lineX-10-width,40+ h*(i+1),huodongPaintText);
                }
                canvas.drawLine(lineX, gridY - 20 - 10, lineX, 30 + 10, huodongPaint);
                //canvas.drawRect(lineX,40,lineX+w*fx+20*fx,40+th,huodongPaint);
            }
        }

//        //起始点。
//        float lastPointX = 0; //前一个点
//        float lastPointY = 0;
//        float currentPointX = 0;//当前点
//        float currentPointY = 0;
//        if (dateY != null) {
//            //1.绘制折线。
//            for (int n = 0; n  0) {//从第二个点开始判断
//                        if (dateY[n - 1] == dateY[n]) {//如果相邻两个点相等一直画直线
//                            //draw line
//                            canvas.drawLine(lastPointX, lastPointY, currentPointX, currentPointY, chartLinePaint);//第一条线[蓝色]
//                        } else {//如果相邻间的点不相等证明是从开到关或者关到开的状态,要画竖线
//                            //draw line  横线
//                            canvas.drawLine(lastPointX, lastPointY, currentPointX, lastPointY, chartLinePaint);//第一条线[蓝色]
//                            //draw line  竖线
//                            canvas.drawLine(currentPointX, lastPointY, currentPointX, currentPointY, chartLinePaint);//第一条线[蓝色]
//                        }
//                    }
//                }
//
//                lastPointX = currentPointX;
//                lastPointY = currentPointY;
//            }
//        }

        //画背景虚线,一条(因为除去了X轴),画Y轴刻度
 //       y = (float) (getHeight() - 60) - 15 - 5 - 1 / ((float) 1.6 * 1) * (getHeight() - 60);//虚线的Y,开关是开的时候的Y。
//        linePaint.setPathEffect(effect);//设法虚线间隔样式。
//        //画除X轴之外的------背景虚线一条-------
//        path.moveTo(gridX, y);//背景【虚线起点】。
//        path.lineTo(getWidth(), y);//背景【虚线终点】。
//        canvas.drawPath(path, linePaint);
//        //画Y轴刻度。
//        canvas.drawText("关", gridX - 6 - 7, gridY - 20, textPaint);
//        canvas.drawText("开", gridX - 6 - 7, y + 10, textPaint);
//
//        //绘制X刻度坐标。
//        float x = 0;
//        if (dateX[0] != null) { //用X来判断,就是用来如果刚开始的点数少于7个则从左到右递增,从而没有了刚开始的几个虚点;(因为X和Y的数组初始化时都没赋值,所以刚开始的时候用这个就可以判断数组中到底几个点)
//            for (int n = 0; n  0) {//从第二个点开始判断
//                        if (dateY[n - 1] == dateY[n]) {//如果相邻两个点相等一直画直线
//                            //draw line
//                            canvas.drawLine(lastPointX, lastPointY, currentPointX, currentPointY, chartLinePaint);//第一条线[蓝色]
//                        } else {//如果相邻间的点不相等证明是从开到关或者关到开的状态,要画竖线
//                            //draw line  横线
//                            canvas.drawLine(lastPointX, lastPointY, currentPointX, lastPointY, chartLinePaint);//第一条线[蓝色]
//                            //draw line  竖线
//                            canvas.drawLine(currentPointX, lastPointY, currentPointX, currentPointY, chartLinePaint);//第一条线[蓝色]
//                        }
//                    }
//                }
//
//                lastPointX = currentPointX;
//                lastPointY = currentPointY;
//            }
//        }
//        //画X轴名字。
//        canvas.drawText("时间", getWidth() / 2 - 10, getHeight() - 18, xyChartPaint);
    }

//    /**
//     * 画点.
//     *
//     * @param canvas
//     */
//    private void drawPoints(Canvas canvas) {
//        for (int i = 0; i  calculate(List x) {
        int n = x.size() - 1;
        float[] gamma = new float[n + 1];
        float[] delta = new float[n + 1];
        float[] D = new float[n + 1];
        int i;
        /*
         * We solve the equation [2 1 ] [D[0]] [3(x[1] - x[0]) ] |1 4 1 | |D[1]|
         * |3(x[2] - x[0]) | | 1 4 1 | | . | = | . | | ..... | | . | | . | | 1 4
         * 1| | . | |3(x[n] - x[n-2])| [ 1 2] [D[n]] [3(x[n] - x[n-1])]
         *
         * by using row operations to convert the matrix to upper triangular and
         * then back sustitution. The D[i] are the derivatives at the knots.
         */

        gamma[0] = 1.0f / 2.0f;
        for (i = 1; i = 0; i--) {
            D[i] = delta[i] - gamma[i] * D[i + 1];
        }

        /* now compute the coefficients of the cubics */
        List cubics = new LinkedList();
        for (i = 0; i 0&&zhi0&&fanwei&&event.getX()
来自 “ ITPUB博客 ” ,链接:https://blog.itpub.net/2751/viewspace-2798074/ ,如需转载,请注明出处,否则将追究法律责任。

请登录后发表评论
登录
全部评论
