转自 https://www.cnblogs.com/David-domain/p/11176070.html
以下文章为转载,今天处理问题需要使用doDBA工具分析mysql,目前发现显示的时间不是连续的,明天继续分析!
目录
1.简介
- doDBA 工具是一个基于命令行的远程系统监控工具。不依赖远程服务器的软件运行。它能实时的收集Linux和MySQL的性能数据。并可以生成一个执行文件来帮助您分析MySQL数据库。
- 这个程序是免费软件。
- doDBA是用go编写的。
2.下载
wget
wget
chmod +x doDBA
或者
git pull
3.使用帮助
./doDBA -help-help # 显示帮助-c string # 指定配置文件 (default "doDBA.conf")-h string # 连接的 host/IP-sys # 打印Linux的信息-myall # 打印Linux和MySQL的信息-mysql # 打印MySQL的信息-innodb # 打印InnoDB存储引擎的信息-mytop # 打印MySQL processlist,类似top-i <duration> # 刷新间隔的秒数 (默认1s)-t <int> #当MySQL Threads_running到达阈值时会输出 show processlist和showengine innodb status到dodba.log中 (默认50)-hP <string> # 主机端口 (默认 "22")-hp <string> # 主机密码-hu <string> # 主机用户 (默认 "root")-mP <string> # MySQL端口 (默认 "3306")-mp <string> # MySQL密码-mu <string> # MySQL用户-rds # 忽略Linux信息-log # 按照日期输出到日志文件-nocolor # 不加颜色输出
4.配置
4.1.模板
cat doDBA.conf{ "Host":"", "Huser": "root", "Hport": "22", "Hpwd": "", "Muser": "dodba", "Mpwd": "dodba", "Mport":"3306"}
4.2.启动命令
./doDBA -c=doDBA.conf
5.部署流程
5.1.下载
5.2.选定被监控主机
5.3.在被监控主机上添加Linux用户、MySQL 用户
Linux:
groupadd dodba
useradd dodba -g dodbaecho xxxx | passwd dbdba --stdin
MySQL:
create user dodba@’xxx.xxx.xxx.%’ identified by ‘dodba’;
grant process on *.* to dodba@'xxx.xxx.xxx.%';
5.4.配置SSH互信
5.5.配置doDBA配置文件,并修改对应参数
5.6.创建日志目录,按照业务、主机、实例等分别创建
mkdir -p /data/doDBA_log/piwik/mysql{1,2}_log/{myall,innodb}
5.7.启动doDBA
- 建议将doDBA安装在某一台主机上,监控其他被监控主机及数据库
5.7.1. 启动脚本,配置了 myall 和 innodb 数据源
cat start_doDBA.sh#!/bin/bashhost_ip=("10.10.xx.xx")
INST_NAME="xxx"data_source=("myall","innodb")for IP in ${host_ip[@]}for SRC in ${data_source[@]}docd /data/doDBA_log/${inst_name}/mysql1_log/myall/
./doDBA -h ${IP} -c /data/doDBA_log/${INST_NAME}/mysql1_log/${SRC}/${INST_NAME}_doDBA.conf -$SRC -t=20 -log  &done
5.8.编辑kill doDBA和start doDBA脚本,已便每天生成一个日志文件。
cat kill_doDBA.sh#!/bin/bashps -ef | grep doDBA | grep -v grep | awk '{print $2}' | xargs kill -9 >/dev/null 2>&1
5.9.配置crontab定时任务。
crontab -e
0 0 # # # sh kill_doDBA.sh1 0 # # # sh start_doDBA.sh
6.数据源参数优先级
- 经过实际测试,一个 doDBA 进程同时只能配置一个数据源参数,配置2个及以上时,只能生效一个,说明参数有优先级的区别。
- 优先级如下:
- mysql > innodb > myall > sys
7.使用示例
7.1. 数据源:mysql
7.1.1. 启动命令
./doDBA -c doDBA.conf -mysql -log
7.1.2.doDBA 发送给 MySQL 的查询语句
show global statuswhere
  Variable_name in (    "Com_select",    "Com_insert",    "Com_update",    "Com_delete",    "Innodb_buffer_pool_read_requests",    "Innodb_buffer_pool_reads",    "Innodb_rows_inserted",    "Innodb_rows_updated",    "Innodb_rows_deleted",    "Innodb_rows_read",    "Threads_running",    "Threads_connected",    "Threads_cached",    "Threads_created",    "Bytes_received",    "Bytes_sent",    "Innodb_buffer_pool_pages_data",    "Innodb_buffer_pool_pages_free",    "Innodb_buffer_pool_pages_dirty",    "Innodb_buffer_pool_pages_flushed",    "Innodb_data_reads",    "Innodb_data_writes",    "Innodb_data_read",    "Innodb_data_written",    "Innodb_os_log_fsyncs",    "Innodb_os_log_written",    "Slow_queries",    "Created_tmp_disk_tables",    "Created_tmp_tables",    "Open_tables",    "Open_files",    "Table_locks_immediate",    "Table_locks_waited"
  );
7.1.3. 输出

7.1.4.每列含义
-
mysql-status
- qps —— Com_select
- tps —— Com_insert + Com_update + Com_delete
- ins —— Com_insert
- upd —— Com_update
- del —— Com_delete
-
threads
- run —— Threads_running
- con —— Threads_connected
- cre —— Threads_created
- cac —— Threads_cached
-
slow
- sql —— Slow_queries
- tmp —— Created_tmp_tables
- dtmp —— Created_tmp_disk_tables
-
bytes
- recv —— Bytes_received
- send —— Bytes_sent
-
locks
- lockI —— Table_locks_immediate
- lockW —— Table_locks_waited
- openT —— Open_tables
- openF —— Open_files
7.2.数据源:innodb
7.2.1.启动命令
./doDBA -c doDBA.conf -innodb -log
7.2.2.doDBA 发送给 MySQL 的查询语句(同7.1.2)
show global statuswhere
  Variable_name in (    "Com_select",    "Com_insert",    "Com_update",    "Com_delete",    "Innodb_buffer_pool_read_requests",    "Innodb_buffer_pool_reads",    "Innodb_rows_inserted",    "Innodb_rows_updated",    "Innodb_rows_deleted",    "Innodb_rows_read",    "Threads_running",    "Threads_connected",    "Threads_cached",    "Threads_created",    "Bytes_received",    "Bytes_sent",    "Innodb_buffer_pool_pages_data",    "Innodb_buffer_pool_pages_free",    "Innodb_buffer_pool_pages_dirty",    "Innodb_buffer_pool_pages_flushed",    "Innodb_data_reads",    "Innodb_data_writes",    "Innodb_data_read",    "Innodb_data_written",    "Innodb_os_log_fsyncs",    "Innodb_os_log_written",    "Slow_queries",    "Created_tmp_disk_tables",    "Created_tmp_tables",    "Open_tables",    "Open_files",    "Table_locks_immediate",    "Table_locks_waited"
  );
7.2.3.输出

7.2.4.每列含义
-
innodb--rows
- read —— Innodb_rows_read
- ins —— Innodb_rows_inserted
- upd —— Innodb_rows_updated
- del —— Innodb_rows_deleted
-
innodb--pages
- data —— Innodb_buffer_pool_pages_data
- free —— Innodb_buffer_pool_pages_free
- dirty —— Innodb_buffer_pool_pages_dirty
- flush —— Innodb_buffer_pool_pages_flushed
-
innodb--data
- reads —— Innodb_data_reads
- writes —— Innodb_data_writes
- read —— Innodb_data_read
- written —— Innodb_data_written
-
innodb-log
- fsyncs —— Innodb_os_log_fsyncs
- written —— Innodb_os_log_written
7.3.数据源:sys
7.3.1.命令
./doDBA -c doDBA.conf -sys -log
7.3.2.输出

7.4.数据源:myall
7.4.1.命令
./doDBA -c doDBA.conf -myall -log
7.4.2.doDBA 发送给 MySQL 的查询语句(同7.1.2)
show global statuswhere
  Variable_name in (    "Com_select",    "Com_insert",    "Com_update",    "Com_delete",    "Innodb_buffer_pool_read_requests",    "Innodb_buffer_pool_reads",    "Innodb_rows_inserted",    "Innodb_rows_updated",    "Innodb_rows_deleted",    "Innodb_rows_read",    "Threads_running",    "Threads_connected",    "Threads_cached",    "Threads_created",    "Bytes_received",    "Bytes_sent",    "Innodb_buffer_pool_pages_data",    "Innodb_buffer_pool_pages_free",    "Innodb_buffer_pool_pages_dirty",    "Innodb_buffer_pool_pages_flushed",    "Innodb_data_reads",    "Innodb_data_writes",    "Innodb_data_read",    "Innodb_data_written",    "Innodb_os_log_fsyncs",    "Innodb_os_log_written",    "Slow_queries",    "Created_tmp_disk_tables",    "Created_tmp_tables",    "Open_tables",    "Open_files",    "Table_locks_immediate",    "Table_locks_waited"
  );
7.4.3.输出

7.4.5.文本输出(GitHub示例)
7.4.5.1.普通输出
/doDBA -h=10.1.xx.xx -myall
DoDBA tools on host 10.1.xx.xx
---------+---load--avg---+-----cpu-usage-----+-swap+----net----+----mysql-status-------+-slow---th---+---bytes---
time     |   1m   5m  10m | usr  sys   iow  ide | si so| recv  send | QPS  TPS  ins  upd  del| sql run  con | recv  send
--------+-----------------+----------------------+------+------------+------------------------+---------------+-----------
13:52:00 | 4.00 3.68 3.60| 0.7  0.3  0.0 99.0 | 0  0 | 316K  4.3M| 203   58   22   36    0 |   0   2    52 |  86K  1.8M
13:52:01 | 4.00 3.68 3.60| 5.3  0.3  0.1 94.3 | 0  0 | 275K  2.0M| 251   67   27   40    0 |   0   3    76 | 104K  3.2M
13:52:02 | 4.00 3.68 3.60| 6.4  0.5  0.1 93.0 | 0  0 | 371K  4.1M| 380  810   24  786  0 |   0   3    40 | 311K  5.0M
13:52:03 | 4.00 3.68 3.60| 5.4  0.4  0.0 94.2 | 0  0 | 510K  4.2M| 648  283   30  253  0 |   1   3   52 | 216K  1.4M
13:52:04 | 4.00 3.68 3.60| 5.7  0.4  0.0 93.8 | 0  0 | 385K  2.7M| 108   69   45   24    0 |   0   4   48 |  71K  2.1M
13:52:05 | 3.92 3.66 3.59| 6.2  0.5  0.0 93.3 | 0  0 | 206K  2.0M| 339   96   52   44    0 |   0   3   37 | 107K  1.9M
7.4.5.2.忽略操作系统信息
./doDBA -h=10.1.xx.xx -myall -rds
DoDBA tools on host 10.1.xx.xx
---------+----load--avg----+-----cpu-usage-----+swap+----net----+-----mysql-status------+-slow---th---+---bytes---
time     |   1m    5m   10m | usr  sys  iow  ide|siso| recv  send|QPS  TPS  ins  upd  del| sql run  con| recv  send
---------+------------------+-------------------+----+-----------+-----------------------+-------------+-----------
17:19:17 | 0.00  0.00  0.00 | 0.0  0.0  0.0  0.0 | 0 0 |   0K    0K | 144  155   73   82   0 |   0   1    5 | 113K  229K
17:19:18 | 0.00  0.00  0.00 | 0.0  0.0  0.0  0.0 | 0 0 |   0K    0K | 66  113   32   81    0 |   0   2    6 |  79K  109K
17:19:19 | 0.00  0.00  0.00 | 0.0  0.0  0.0  0.0 | 0 0 |   0K    0K | 273  117   30   87   0 |   1   2   20 | 135K  502K
17:19:20 | 0.00  0.00  0.00 | 0.0  0.0  0.0  0.0 | 0 0 |   0K    0K | 207  173   74   99   0 |   1   2   17 | 137K  279K
17:19:21 | 0.00  0.00  0.00 | 0.0  0.0  0.0  0.0 | 0 0 |   0K    0K | 161  233  105  128 0 |   0   1    5 | 146K  193K
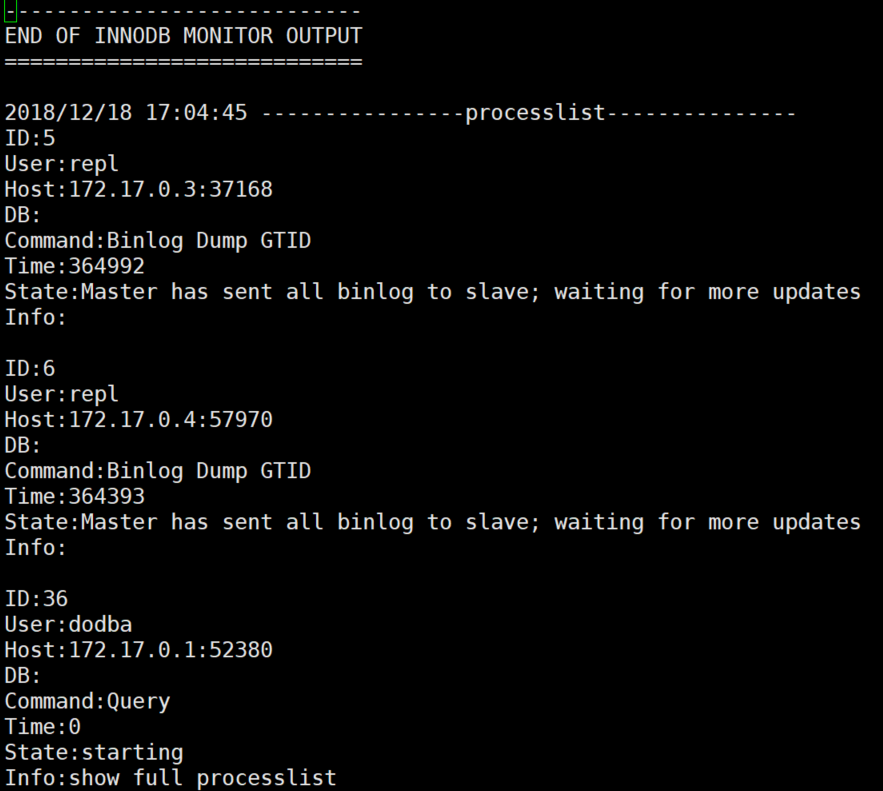
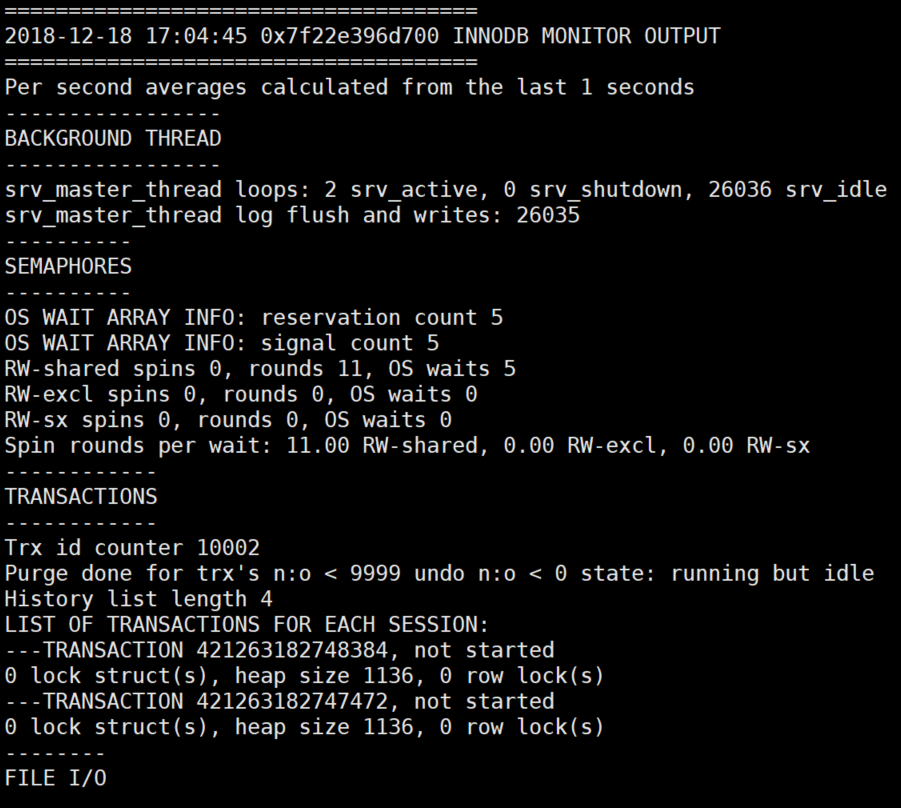
7.4.5.3.加入 doing 选项,当 Thread_running >= 3 时,执行show processlist 和 show engine innodb status
./doDBA -h=10.1.xx.xx -myall -t=3
2016/12/14 11:47:52 ----------------processlist---------------
ID:606374462
User:ums_read
Host:10.1.xx.xx:31886
DB:mia
Command:Query
Time:3121
State:Sending data
Info:SELECT ......................
=====================================
2016-12-14 11:49:16 7f93ece24700 INNODB MONITOR OUTPUT
=====================================
Per second averages calculated from the last 1 seconds
-----------------
BACKGROUND THREAD
-----------------
srv_master_thread loops: 11256164 srv_active, 0 srv_shutdown, 27867 srv_idle
srv_master_thread log flush and writes: 11284031
----------
SEMAPHORES
----------
OS WAIT ARRAY INFO: reservation count 1562657988
OS WAIT ARRAY INFO: signal count 11589318962
Mutex spin waits 7915500772, rounds 7044249291, OS waits 29061199
RW-shared spins 15964124137, rounds 99809511531, OS waits 1188604739
RW-excl spins 1056480533, rounds 26766008869, OS waits 261290579
........................................
7.5.数据源:mytop
7.5.1.命令
./doDBA -c doDBA.conf -mytop

7.5.3.注意事项
- mytop的输出类似 top 命令,是实时刷新的,不能加 -log 选项
来自 “ ITPUB博客 ” ,链接:https://blog.itpub.net/26451536/viewspace-2844519/ ,如需转载,请注明出处,否则将追究法律责任。

请登录后发表评论
登录
全部评论
