Python计算机视觉:第一章 图像处理基础
[www.pythonware.com/products/pil/]。下面演示原书P001-Fig1-1读入一幅图片的例子:# -*- coding: utf-8 -*-from PIL import Imagefrom pylab import *# 添加中文字体支持from matplotlib.font_manager import FontPropertiesfont = FontProperties(fname=r"c:windowsfontsSimSun.ttc", size=14)figure()pil_im = Image.open('../data/empire.jpg')gray()subplot(121)title(u'原图',fontproperties=font)axis('off')imshow(pil_im)pil_im = Image.open('../data/empire.jpg').convert('L')subplot(122)title(u'灰度图',fontproperties=font)axis('off')imshow(pil_im)show()
运行上面的代码,可以得出原书P002-Fig1-1中的前两幅图片,如下: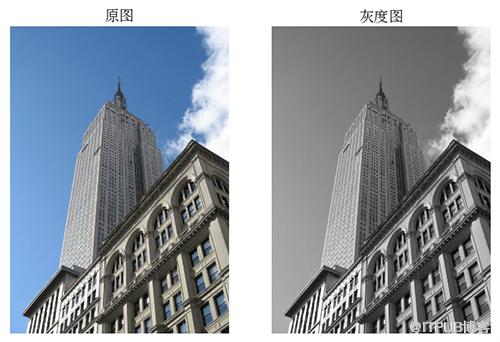 更多关于PIL的实例,可以参阅PIL在线文档[www .pythonware.com/library/pil/handbook/index.htm./]。
[PCV模块的安装]运行上面代码,可以得到转化格式后的图像,运行结果为: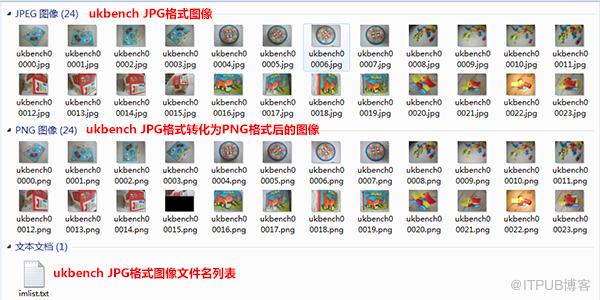
[matplotlib.sourceforge.net]上下载,并且它还提供了详细的文档及教程。这里,会展示一些我们在本书后面会用到的函数的一些实例。
NumPy是Python一个流行的用于科学计算包。它包含了很多诸如矢量、矩阵、图像等其他非常有用的对象和线性代数函数。在本书中几乎所有的例子都用到了NumPy数组对象。NumPy可以在scipy.org/Download]下载,在线文档包含了很多常见问题的答案。
[Images courtesy of Martin Solli]下载。下面代码是显示原书P14页对字体图像进行主成分分析的实例代码: # -*- coding: utf-8 -*-import picklefrom PIL import Imagefrom numpy import *from pylab import *from PCV.tools import imtools, pca# Uses sparse pca codepath.#imlist = imtools.get_imlist('../data/selectedfontimages/a_selected_thumbs')# 获取图像列表和他们的尺寸imlist = imtools.get_imlist('../data/fontimages/a_thumbs') # fontimages.zip is part of the book data setim = array(Image.open(imlist[0])) # open one image to get the sizem, n = im.shape[:2] # get the size of the imagesimnbr = len(imlist) # get the number of imagesprint "The number of images is %d" % imnbr# Create matrix to store all flattened imagesimmatrix = array([array(Image.open(imname)).flatten() for imname in imlist], 'f')# PCA降维V, S, immean = pca.pca(immatrix)# 保存均值和主成分#f = open('../ch01/font_pca_modes.pkl', 'wb')#pickle.dump(immean,f)#pickle.dump(V,f)#f.close()# Show the images (mean and 7 first modes)# This gives figure 1-8 (p15) in the book.figure()gray()subplot(2, 4, 1)axis('off')imshow(immean.reshape(m, n))for i in range(7):
subplot(2, 4, i+2)
imshow(V[i].reshape(m, n))
axis('off')show()
NumPy是Python一个流行的用于科学计算包。它包含了很多诸如矢量、矩阵、图像等其他非常有用的对象和线性代数函数。在本书中几乎所有的例子都用到了NumPy数组对象。NumPy可以在scipy.org/Download]下载,在线文档包含了很多常见问题的答案。
[Images courtesy of Martin Solli]下载。下面代码是显示原书P14页对字体图像进行主成分分析的实例代码: # -*- coding: utf-8 -*-import picklefrom PIL import Imagefrom numpy import *from pylab import *from PCV.tools import imtools, pca# Uses sparse pca codepath.#imlist = imtools.get_imlist('../data/selectedfontimages/a_selected_thumbs')# 获取图像列表和他们的尺寸imlist = imtools.get_imlist('../data/fontimages/a_thumbs') # fontimages.zip is part of the book data setim = array(Image.open(imlist[0])) # open one image to get the sizem, n = im.shape[:2] # get the size of the imagesimnbr = len(imlist) # get the number of imagesprint "The number of images is %d" % imnbr# Create matrix to store all flattened imagesimmatrix = array([array(Image.open(imname)).flatten() for imname in imlist], 'f')# PCA降维V, S, immean = pca.pca(immatrix)# 保存均值和主成分#f = open('../ch01/font_pca_modes.pkl', 'wb')#pickle.dump(immean,f)#pickle.dump(V,f)#f.close()# Show the images (mean and 7 first modes)# This gives figure 1-8 (p15) in the book.figure()gray()subplot(2, 4, 1)axis('off')imshow(immean.reshape(m, n))for i in range(7):
subplot(2, 4, i+2)
imshow(V[i].reshape(m, n))
axis('off')show()
 # -*- coding: utf-8 -*-import picklefrom PIL import Imagefrom numpy import *from pylab import *from PCV.tools import imtools, pca# Uses sparse pca codepath.#imlist = imtools.get_imlist('../data/selectedfontimages/a_selected_thumbs')# 获取图像列表和他们的尺寸imlist = imtools.get_imlist('../data/fontimages/a_thumbs')  # fontimages.zip is part of the book data setim = array(Image.open(imlist[0]))  # open one image to get the sizem, n = im.shape[:2]  # get the size of the imagesimnbr = len(imlist)  # get the number of imagesprint "The number of images is %d" % imnbr# Create matrix to store all flattened imagesimmatrix = array([array(Image.open(imname)).flatten() for imname in imlist], 'f')# PCA降维V, S, immean = pca.pca(immatrix)# 保存均值和主成分#f = open('../ch01/font_pca_modes.pkl', 'wb')#pickle.dump(immean,f)#pickle.dump(V,f)#f.close()# Show the images (mean and 7 first modes)# This gives figure 1-8 (p15) in the book.figure()gray()subplot(2, 4, 1)axis('off')imshow(immean.reshape(m, n))for i in range(7):
    subplot(2, 4, i+2)
    imshow(V[i].reshape(m, n))
    axis('off')show()
注意,这些图像在拉成一维表示后,必须用reshape()函数将它重新转换回来。运行上面代码,可得原书P15 Figure1-8中的结果,即: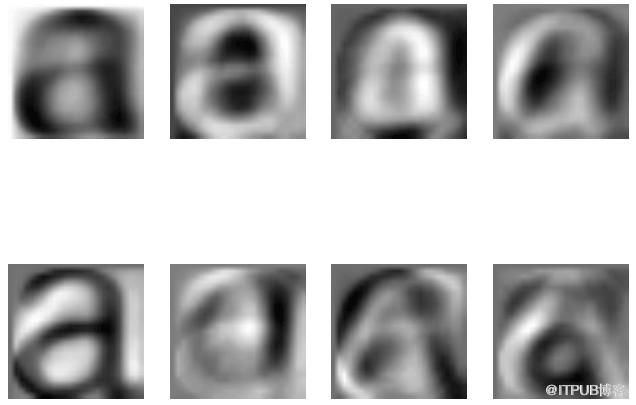
SciPy是一个开源的数学工具包,它是建立在NumPy的基础上的。它提供了很多有效的常规操作,包括数值综合、最优化、统计、信号处理以及图像处理。正如接下来所展示的,SciPy库包含了很多有用的模块。SciPy库可以再[http://scipy.org/Download]下载。
[docs.scipy.org/doc/scipy/reference/ndimage.html]。
[en.wikipedia.org/wiki/Mathematical_morphology]。
[en.wikipedia.org/wiki/Mathematical_morphology]。
形态学操作包括在sci.ndimage模块morphology中。下面我们看一个简单地怎样使用它们例子。
# -*- coding: utf-8 -*-from PIL import Imagefrom numpy import *from scipy.ndimage import measurements, morphologyfrom pylab import *""" This is the morphology counting objects example in Section 1.4. """# 添加中文字体支持from matplotlib.font_manager import FontPropertiesfont = FontProperties(fname=r"c:windowsfontsSimSun.ttc", size=14)# load image and threshold to make sure it is binaryfigure()gray()im = array(Image.open('../data/houses.png').convert('L'))subplot(221)imshow(im)axis('off')title(u'原图', fontproperties=font)im = (im 运行上面代码,可得原书P022 Fig1-12的结果: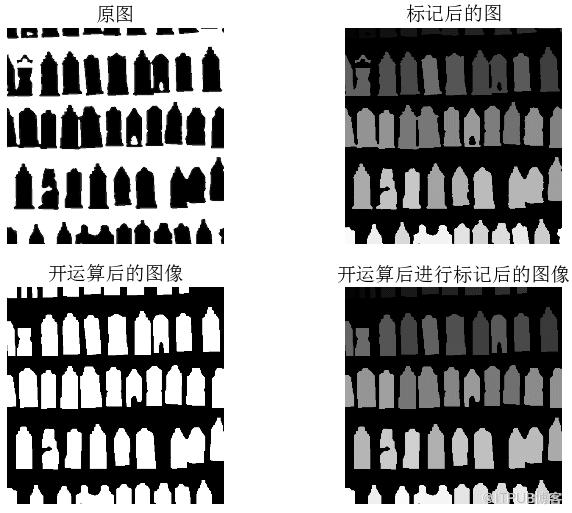 同时打印计数结果为:
Number of objects: 45
Number of objects: 48
更多关于形态学可以参阅scipy.ndimage在线文档[docs.scipy.org/doc/scipy/reference/ndimage.html]。
[docs.scipy.org/doc/scipy/reference/io.html]。保存数组为图像
在scipy.misc模块中,包含了imsave()函数,要保存数组为一幅图像,可通过下面方式完成:
from scipy.misc import imsaveimsave('test.jpg',im)scipy.misc模块中还包含了著名的"Lena"测试图像:
lena = scipy.misc.lena()
上面得到的lena图像是一幅512*512大小的灰度图像。
原文出处
来自 “ ITPUB博客 ” ,链接:https://blog.itpub.net/2611/viewspace-2801609/ ,如需转载,请注明出处,否则将追究法律责任。
上一篇:
Java 阿里云短信服务的集成
下一篇:
python--装饰器(附偏函数、断言)

请登录后发表评论
登录
全部评论
