通过日志的频繁切换可以说明数据库处于繁忙状态,利用每个日志的切换时间我们可以生成一个曲线图来分析一日的数据库的运行高峰时间段。
1.SQL语句
select tt.timepoint,sum(redocount) redocount from (select t.timepoint, count(*) redocount
from (select ceil((to_number(to_char(first_time, 'hh24')) * 60 * 60 +
to_number(to_char(first_time, 'mi')) * 60 +
to_number(to_char(first_time, 'ss'))) / (30 * 60)) timepoint
from v$log_history
where first_time > to_date('&start_time', 'yyyy-mm-dd')
and first_time <= to_date('&end_time', 'yyyy-mm-dd')) t
group by t.timepoint
union all
select rownum timepoint,0 redocount from dual connect by rownum <=48
)tt group by tt.timepoint order by tt.timepoint;
2.输出结果
(每半小时一个时间点,统计上个时间点到这个时间点之间的日志切换个数)
1 2
2 0
3 0
4 1
5 2
6 0
7 0
8 0
9 0
10 0
11 0
12 0
13 0
14 0
15 1
16 0
17 0
18 0
19 0
20 0
21 0
22 0
23 1
24 0
25 0
26 0
27 0
28 0
29 1
30 0
31 0
32 0
33 0
34 0
35 0
36 0
37 0
38 0
39 0
40 0
41 0
42 0
43 0
44 0
45 0
46 0
47 0
48 0
3.利用excel生成一个曲线图
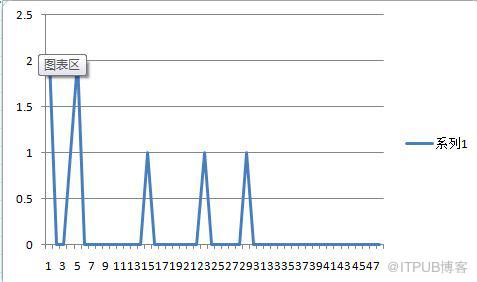
日分布图都出来了月分布图也出来了。
1.SQL语句
select tt.timepoint,sum(redocount) redocount from (select t.timepoint, count(*) redocount
from (select ceil((to_number(to_char(first_time, 'hh24')) * 60 * 60 +
to_number(to_char(first_time, 'mi')) * 60 +
to_number(to_char(first_time, 'ss'))) / (30 * 60)) timepoint
from v$log_history
where first_time > to_date('&start_time', 'yyyy-mm-dd')
and first_time <= to_date('&end_time', 'yyyy-mm-dd')) t
group by t.timepoint
union all
select rownum timepoint,0 redocount from dual connect by rownum <=48
)tt group by tt.timepoint order by tt.timepoint;
2.输出结果
(每半小时一个时间点,统计上个时间点到这个时间点之间的日志切换个数)
1 2
2 0
3 0
4 1
5 2
6 0
7 0
8 0
9 0
10 0
11 0
12 0
13 0
14 0
15 1
16 0
17 0
18 0
19 0
20 0
21 0
22 0
23 1
24 0
25 0
26 0
27 0
28 0
29 1
30 0
31 0
32 0
33 0
34 0
35 0
36 0
37 0
38 0
39 0
40 0
41 0
42 0
43 0
44 0
45 0
46 0
47 0
48 0
3.利用excel生成一个曲线图
日分布图都出来了月分布图也出来了。
4.Toad中输出的日志统计SQL:
SELECT trunc(first_time) "Date",
to_char(first_time, 'Dy') "Day",
count(1) "Total",
SUM(decode(to_char(first_time, 'hh24'),'00',1,0)) "h0",
SUM(decode(to_char(first_time, 'hh24'),'01',1,0)) "h1",
SUM(decode(to_char(first_time, 'hh24'),'02',1,0)) "h2",
SUM(decode(to_char(first_time, 'hh24'),'03',1,0)) "h3",
SUM(decode(to_char(first_time, 'hh24'),'04',1,0)) "h4",
SUM(decode(to_char(first_time, 'hh24'),'05',1,0)) "h5",
SUM(decode(to_char(first_time, 'hh24'),'06',1,0)) "h6",
SUM(decode(to_char(first_time, 'hh24'),'07',1,0)) "h7",
SUM(decode(to_char(first_time, 'hh24'),'08',1,0)) "h8",
SUM(decode(to_char(first_time, 'hh24'),'09',1,0)) "h9",
SUM(decode(to_char(first_time, 'hh24'),'10',1,0)) "h10",
SUM(decode(to_char(first_time, 'hh24'),'11',1,0)) "h11",
SUM(decode(to_char(first_time, 'hh24'),'12',1,0)) "h12",
SUM(decode(to_char(first_time, 'hh24'),'13',1,0)) "h13",
SUM(decode(to_char(first_time, 'hh24'),'14',1,0)) "h14",
SUM(decode(to_char(first_time, 'hh24'),'15',1,0)) "h15",
SUM(decode(to_char(first_time, 'hh24'),'16',1,0)) "h16",
SUM(decode(to_char(first_time, 'hh24'),'17',1,0)) "h17",
SUM(decode(to_char(first_time, 'hh24'),'18',1,0)) "h18",
SUM(decode(to_char(first_time, 'hh24'),'19',1,0)) "h19",
SUM(decode(to_char(first_time, 'hh24'),'20',1,0)) "h20",
SUM(decode(to_char(first_time, 'hh24'),'21',1,0)) "h21",
SUM(decode(to_char(first_time, 'hh24'),'22',1,0)) "h22",
SUM(decode(to_char(first_time, 'hh24'),'23',1,0)) "h23",
round(count(1) / 24, 2) "Avg"
FROM V$log_history
group by trunc(first_time), to_char(first_time, 'Dy')
Order by 1
/
 捕获.JPG
来自 “ ITPUB博客 ” ,链接:https://blog.itpub.net/23135684/viewspace-630949/ ,如需转载,请注明出处,否则将追究法律责任。

请登录后发表评论
登录
全部评论
